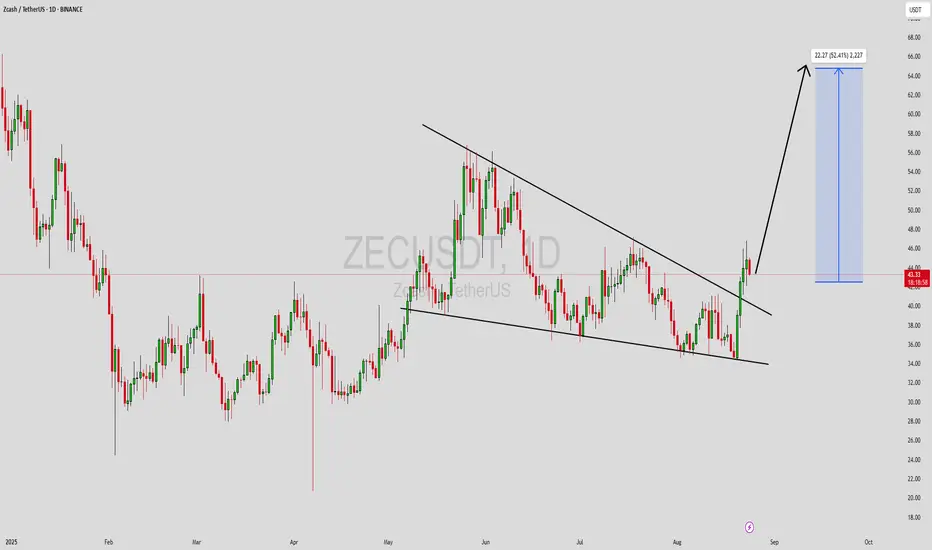
ZECUSDT Forming Bullish MomentumZECUSDT is forming a clear bullish momentum pattern, a classic bullish reversal signal that often indicates an upcoming breakout. The price has been consolidating within a narrowing range, suggesting that selling pressure is weakening while buyers are beginning to regain control. With consistent volume confirming accumulation at lower levels, the setup hints at a potential bullish breakout soon. The projected move could lead to an impressive gain of around 80% to 90% once the price breaks above the wedge resistance.
This falling wedge pattern is typically seen at the end of downtrends or corrective phases, and it represents a potential shift in market sentiment from bearish to bullish. Traders closely watching ZECUSDT are noting the strengthening momentum as it nears a breakout zone. The good trading volume adds confidence to this pattern, showing that market participants are positioning early in anticipation of a reversal.
Investors’ growing interest in ZECUSDT reflects rising confidence in the project’s long-term fundamentals and current technical strength. If the breakout confirms with sustained volume, this could mark the start of a fresh bullish leg. Traders might find this a valuable setup for medium-term gains, especially as the wedge pattern completes and buying momentum accelerates.
✅ Show your support by hitting the like button and
✅ Leaving a comment below! (What is your opinion about this Coin?)
Your feedback and engagement keep me inspired to share more insightful market analysis with you!
Zecusdlong

ZEC — Daily & 4H Bias (Long & Short Scenarios)Price broke out of the prior consolidation around 449.46, where buyers stepped in on the 4H timeframe. This was confirmed by a bullish engulfing move, followed by a brief pause near 472.13.
However, the bullish momentum weakened as price entered a higher-timeframe supply zone (513.70 – 554.93) — a previous sell-off area. Although price swept above this zone, it failed to sustain acceptance and began to reverse
From there:
Market broke initial structure
Printed a lower low, followed by a reaction from buyers
Price pushed up to 536.37, but momentum was insufficient to break the prior high
This formed the first lower high
A subsequent sell-off broke the previous low, creating a new low at 480.32
Another push up failed again, forming a second lower high
With two confirmed lower highs and lower lows, market structure currently favors continuation to the downside.
Trade Scenario's
Short bias:
Shorting at market offers poor R:R.
A more favorable setup would be a limit short around 523.59, within the supply zone.
Long bias:
Alternatively, price may retrace into daily demand (435.71 – 449.46), where a long setup could form if buyers step in.
Both scenarios are marked on the chart — patience and confirmation are key.
Appreciate everyone’s input. If you have a different bias, feel free to share.
Follow my journey on X: @CTucker99670
I’ll be actively posting my market bias and learning progress.
Happy trading 📊

ZEC/USDT – Head & Shoulders Pullback within Rising ChannelHi!
Pattern: Head & Shoulders (short-term correction)
Trend: Overall bullish (ascending channel intact)
➡️ After forming a Head & Shoulders near the top of the channel, price saw a healthy pullback
➡️ Price is now approaching the lower boundary of the rising channel, which acts as strong dynamic support
➡️ As long as this support holds, the broader uptrend remains valid
🎯 Bullish Targets:
TP1: 520
TP2: 550
A deeper correction is possible, but buyers are expected to step in near channel support

#ZEC/USDT – Potential Long Setup at Key Fibonacci Level#ZEC
The price is moving in a descending channel on the 1-hour timeframe. It has reached the lower boundary and is heading towards breaking above it, with a retest of the upper boundary expected.
We have a downtrend on the RSI indicator, which has reached near the lower boundary, and an upward rebound is expected.
There is a key support zone in green at 296. The price has bounced from this zone multiple times and is expected to bounce again.
We have a trend towards stability above the 100-period moving average, as we are moving close to it, which supports the upward move.
Entry price: 334
First target: 352
Second target: 386
Third target: 430
Don't forget a simple principle: money management.
Place your stop-loss below the support zone in green.
For any questions, please leave a comment.
Thank you.

ZEC Reaction Update: Clean Tag of 300 and a Violent BounceZEC just delivered the exact reaction we were looking for at the 300 level. I kept the original teal projection on the chart for reference since the broader structure is still playing out, but price moved faster than expected. I anticipated a bit more chop and a slower drift into support, yet ZEC went straight down into the 300 zone and instantly snapped back with a strong, aggressive bounce.
This type of behavior reinforces how significant that 300 level is. Buyers were waiting there with size, and the immediate reversal shows clear demand absorption and a potential shift in short term momentum. Even though the path was steeper than projected, the core idea remains intact: 300 is major support, and the reaction confirms it.
Now we watch to see whether ZEC can build structure above this bounce and start forming higher lows. For now, the key takeaway is simple: the market respected the level perfectly, and the response was far more decisive than expected.

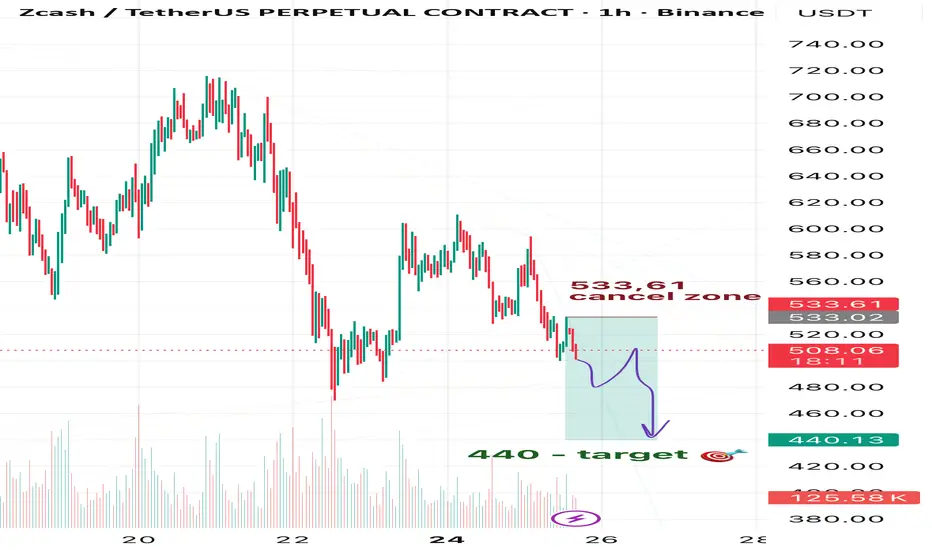
ZEC: Downside Scenario Still in PlayHi, friends! 👋
Yesterday, ZEC broke through my scenario invalidation zone. Earlier, I shared an idea expecting ZEC to move toward 480 and lower. Despite this breakout, the broader bearish setup is not invalidated — in fact, ZEC has only confirmed its intention to continue downward 📉
My targets:
🎯 Target 1: 480
🎯 Target 2: 460
🎯 Target 3: 440
❌ Plan invalidation zone: 533.61
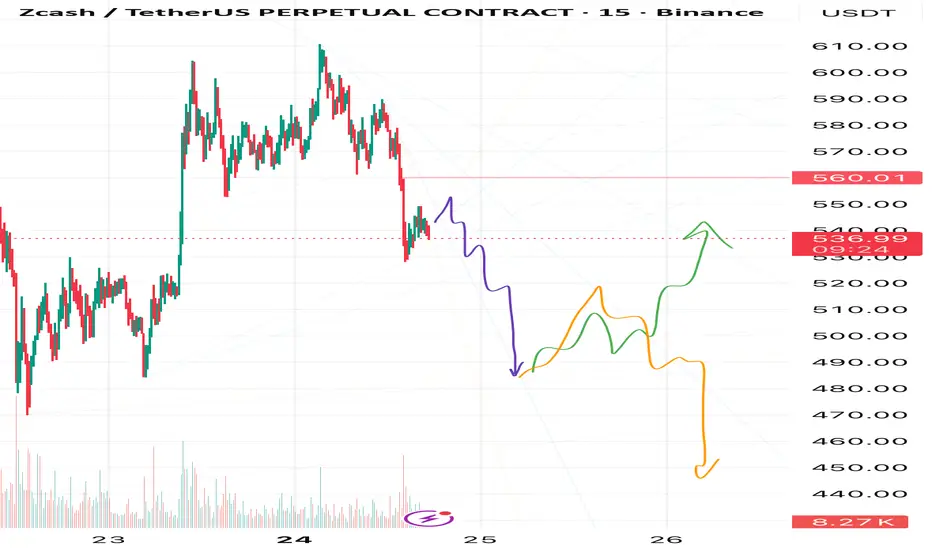
ZEC Weekly Outlook: Crucial Zones & Scenario BreakdownHi, friends! 👋
A brand new trading week has just begun — wishing all of you a profitable one! 💸
I’ll do my best to contribute with timely analysis and updates.
Today we’re taking a look at ZEC .
In my view, after reaching the 550–555 zone, we may see ZEC drop toward 480 .
From there, I’m considering two potential scenarios — the green and the orange arrows.
I’m personally leaning toward the orange path 🟧, but I can’t be fully confident until we see how the initial purple move plays out.
❌Also — the cancel zone for the purple scenario is at 560 . If price breaks above that level, the purple scenario becomes invalid .
As the purple scenario begins to unfold, I’ll be posting updates so you don’t miss any shifts 📈
What do you think?
Will ZEC follow the orange arrow or the green one?
And do you think ZEC will complete the initial purple move at all?
Share your thoughts in the comments — I’m genuinely interested in your view! 💬
👉 Make sure to follow and hit “Like” so you don’t miss upcoming updates!
⚠️ Disclaimer: This is not financial advice and not a call to action. This is only my personal market view. Please make decisions according to your own trading system.
ZKUSDT - Don't waste this opportunity!Did you know that ZK dropped more than 98.5% from its peak in December 2024 until October 10, 2025?
If you can’t imagine what that means, let me explain:
Coins that experience such a massive drop usually get delisted and die off—they rarely recover.
But ZK surged over 1,300% from its October 10 bottom in less than 23 days and is now about to break a major resistance at the 0.618 Fibonacci level.
And I want to point out something:
ZEC and ZK sound similar, and even their letters resemble each other—definitely a hint at the market makers’ codes.
Best Regards:
Ceciliones🎯

ZECUSDTMy idea is bullish for BINANCE:ZECUSDT .
But keep 220$ support.
Next target is 290 - 370
Support: 220 - 1755 - 125 - 78
⚠️Please control risk management.

ZEC on Deck — Correction CheckI expect a correction on ZECUSDT.
My downside targets are:
1️⃣ 210
2️⃣ 188
3️⃣ 156
The invalidation zone is marked in red on the chart.

Zcash Breaks 2018 Downtrend: Confirming a Multi-Year Bull Run Zcash has just broken a trendline that had been in place since 2018. Even though the movement of the last few days might seem exaggeratedly wide, in reality, it's just the confirmation of the start of a bullish trend that will likely last for years. From both a technical and fundamental analysis perspective, it's one of the 5 most interesting coins in absolute terms. It has been undervalued for years due to fears of delisting and FUD, but institutional investors have bet heavily on it while retail investors were discouraged. That said, I wouldn't enter a position at this price, but possibly around $80-100. Personally, I've accumulated for years below $40, but on this confirmation, I'd definitely add capital. The next important resistance is the last reversal point from the previous cycle, so around $300. Dips around $100 are to be bought if they are granted. Thanks to everyone for the attention.

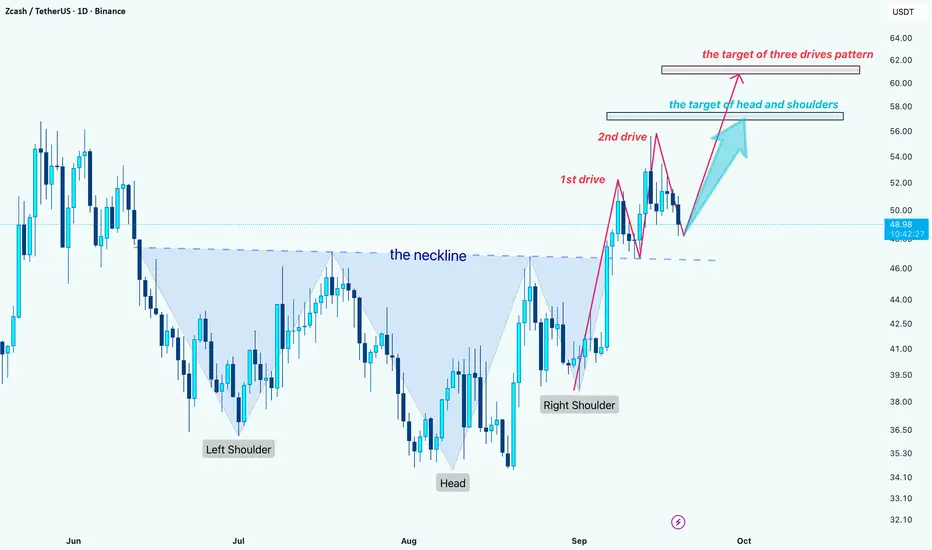
ZEC: Bullish Breakout with $57 and $61 Targets AheadHello guys!
ZEC is showing some interesting technical setups right now:
First, the chart has completed a Head & Shoulders reversal and successfully broken above the neckline. Based on this structure, the next potential upside target sits around $57.
On a lower level, the price is also shaping a Three Drives pattern. If this plays out, the extension could take ZEC higher toward the $61 zone.
Overall, the technical picture looks bullish as long as the price holds above the neckline. A breakout confirmation with momentum could push ZEC step by step toward those targets.
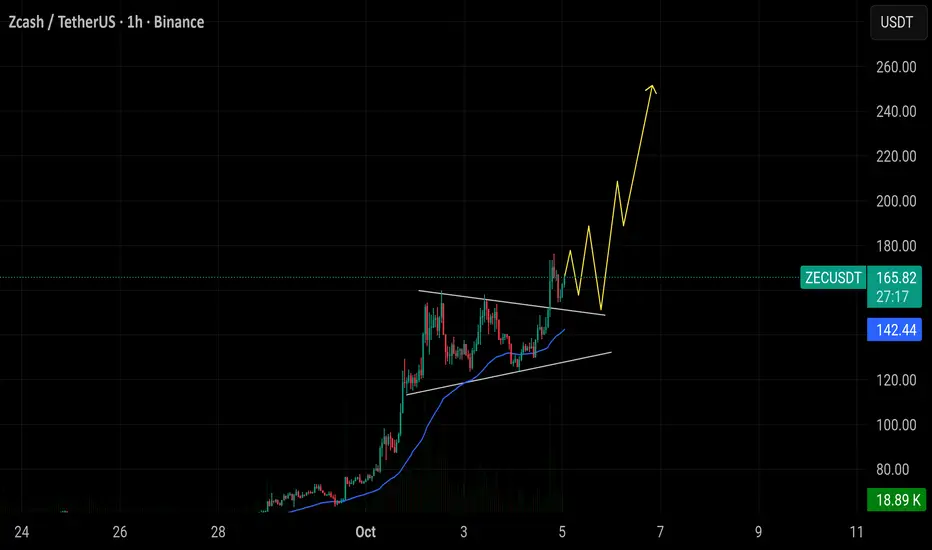
$ZEC/USDT has broken out of its wedge pattern and is currently $ZEC/USDT has broken out of its wedge pattern and is currently trading near 164. If price holds above 150, momentum could continue toward the 200–240 zone. The lower trendline support around 130 remains the key level to maintain the overall bullish structure.
#ZEC/USDT Breakout Confirmed - Bullish Rally Loading!#ZEC
The price is moving within a descending channel on the 1-hour frame, adhering well to it, and is heading for a strong breakout and retest.
We have a bearish trend on the RSI indicator that is about to be broken and retested, which supports the upward breakout.
There is a major support area in green at 48.26, representing a strong support point.
For inquiries, please leave a comment.
We are in a consolidation trend above the 100 Moving Average.
Entry price: 52.70
First target: 53.70
Second target: 54.90
Third target: 56.85
Don't forget a simple matter: capital management.
When you reach the first target, save some money and then change your stop-loss order to an entry order.
For inquiries, please leave a comment.
Thank you.

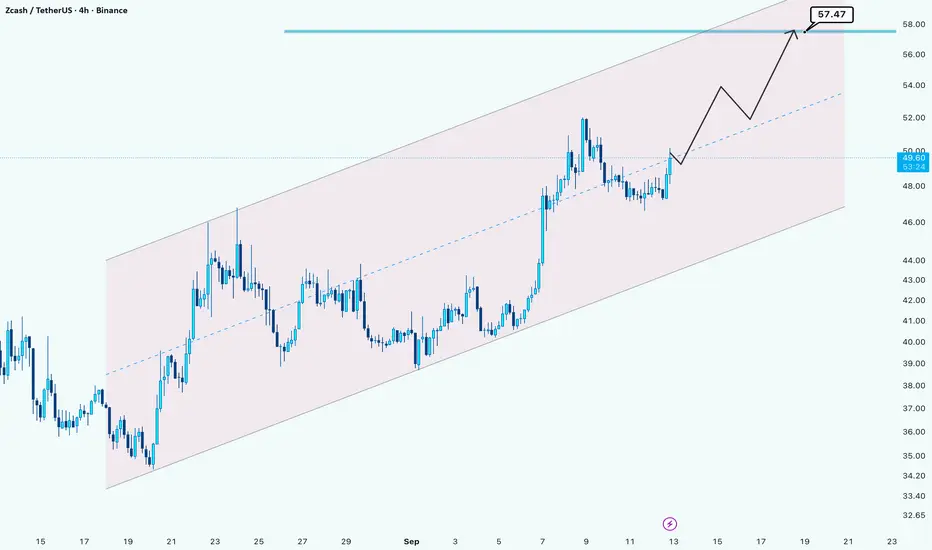
ZEC/USDT –> Climbing the Channel Toward $57.5Hello guys!
ZEC/USDT is trading inside an ascending channel and has recently bounced off the midline support. As long as the price holds above the $48–$49 zone, the bullish structure remains intact. The next key target sits near $57.5, which coincides with the channel’s upper boundary.
also in daily time frame it formed a head and shoulders pattern so it confirmed the bullish trend!
ZECUSDT Forming Bullish WaveZECUSDT is showing a bullish wave pattern on the charts, which is typically a continuation signal that highlights strong buying momentum building up in the market. After a period of consolidation, the price appears to be preparing for another upward move, and the bullish wave formation suggests that momentum traders and investors may be positioning for a breakout. With technicals aligning in favor of the bulls, ZECUSDT could deliver a promising 40% to 50% upside if the momentum sustains.
The trading volume adds further confirmation to this outlook, as consistent buyer participation indicates growing confidence in this project. Healthy volume during upward price movements is a key signal that institutional and retail investors are taking positions in anticipation of a larger rally. This kind of accumulation often precedes strong surges in price action.
With increased market interest and technical strength backing the setup, ZECUSDT is well-positioned to attract both short-term traders and long-term investors. A decisive continuation of the bullish wave pattern could trigger a strong breakout rally, making it an attractive watch for those seeking mid-term gains in the crypto market.
✅ Show your support by hitting the like button and
✅ Leaving a comment below! (What is You opinion about this Coin)
Your feedback and engagement keep me inspired to share more insightful market analysis with you!
ZECUSDT UPDATE#ZEC
UPDATE
ZEC Technical Setup
Pattern : Bullish Wave pattern
Current Price: $43.49
Target Price: $69.50
Target % Gain: 61%
Technical Analysis: ZEC has broken out of the falling wedge on the 1D chart with strong bullish momentum. The breakout candle closed above trendline resistance, confirming upside potential. If price sustains above $43, continuation toward $69 is likely.
Time Frame: 1D
Risk Management Tip: Always use proper risk management.

ZECUSDT Breakout Confirmed - Bullish Rally Loading!BINANCE:ZECUSDT has officially broken above a strong horizontal resistance zone that had been acting as a ceiling for several weeks. The 4H chart clearly shows a breakout with strong bullish candles and consolidation just above the breakout level. a classic bullish retest structure.
This resistance zone had been tested multiple times in the past, making the breakout even more significant. What’s more promising is the clean shift from a range-bound structure to higher highs, supported by a well-defined base of accumulation at the lower support level.
Stay sharp, always manage your risk, and don’t forget to set a proper stop loss. The trend is strong, and momentum is building!
BINANCE:ZECUSDT Currently trading at $44
Buy level : Above $44
Stop loss : Below $39.5
Target 1: $47
Target 2: $53
Target 3: $60
Max leverage 5x
Always keep stop loss
Follow Our Tradingview Account for More Technical Analysis Updates, | Like, Share and Comment Your thoughts

ZECUSDT 1WZEC ~ 1W Analysis
#ZEC Buy gradually from here if you still have a Conviction on this coin with a short -term target of at least 20%+.

#ZEC/USDT#ZEC
The price is moving in a descending channel on the 1-hour frame and is expected to continue upward.
We have a trend to stabilize above the 100 moving average once again.
We have a downtrend on the RSI indicator that supports the upward move with a breakout.
We have a support area at the lower boundary of the channel at 37.40.
Entry price: 37.90
First target: 38.82
Second target: 40
Third target: 41

ZECUSDT 1WZEC ~ 1W Analysis
#ZEC So far it still maintains its bullish structure. Buy from here if you still have a Conviction on this coin with a minimum target of 20%+.

ZECUSDT 1WZEC ~ 1W Analysis
#ZEC This is the lowest support for now. Buy gradually from here if you still have a Conviction on this Coin with a minimum target of 20%+

$ZECUSDT : Privacy Coin Ready to Rally?BINANCE:ZECUSDT , a leading privacy-focused cryptocurrency, has demonstrated a strong rebound following a recent market downturn. This resilience has captured the attention of the crypto community, sparking renewed interest in the coin. Technically, BYBIT:ZECUSDT.P has exhibited a pattern of overcoming resistance levels, forming higher highs, and suggesting a bullish trajectory. The current resistance at $80 is a critical hurdle. A successful breach of this level could potentially unleash significant upward momentum. Traders are advised to exercise prudent risk management practices, including setting stop-loss orders, to mitigate potential losses.
COINBASE:ZECUSD Currently trading at $53
Buy level: Above $44
Stop loss: Below $34
Target : $200
Max Leverage 3x
Always keep Stop loss
Follow Our Tradingview Account for More Technical Analysis Updates, | Like, Share and Comment Your thoughts
