Zcash: Mapping the Multi-Layer Retest | Path to Trendline RetestZcash will enter a critical decision phase if price falls and holds under $491, which suggests a potential shift in momentum that places us in a consolidation range. We would then be operating within a consolidation box potentially. My focus is on the multi-layered support structure below us.
Near-Term Bullish Structure: We must hold the $473–$479 area. A bounce and break back above the 490s here keeps the immediate momentum intact.
The Fake-out Risk: Watch $468 closely. "Prior highs become support" logic suggests a bounce point, Could be a potential fake-out zone to catch late shorts chasing a trendline breakdown—don't get trapped.
The Mid-Layer: Below the potential fake-out zone, we have a secondary structural layer encompassing the prior and secondary highs.
The Macro Target: The actual trendline retest—and the highest-probability entry—sits in the $432–$435 confluence zone. This is the 3rd layer where the full breakout logic is truly tested.
⚠️ Risk Management & Invalidation
While the outlook remains constructive above the trendline, we must respect the downside risk:
The Red Flag: If price falls and closes under $425, the bullish retest thesis is under significant pressure.
Structural Breakdown: A break under the $390–$405 zone would suggest that the probability of a further breakdown has increased significantly.
The "C-Wave" Scenario: Losing the $390 level could trigger a major C-Wave correction, potentially leading to a deep retracement as low as the mid-$200s.
ZECUSDT

ZEC — Daily & 4H Bias (Long & Short Scenarios)Price broke out of the prior consolidation around 449.46, where buyers stepped in on the 4H timeframe. This was confirmed by a bullish engulfing move, followed by a brief pause near 472.13.
However, the bullish momentum weakened as price entered a higher-timeframe supply zone (513.70 – 554.93) — a previous sell-off area. Although price swept above this zone, it failed to sustain acceptance and began to reverse
From there:
Market broke initial structure
Printed a lower low, followed by a reaction from buyers
Price pushed up to 536.37, but momentum was insufficient to break the prior high
This formed the first lower high
A subsequent sell-off broke the previous low, creating a new low at 480.32
Another push up failed again, forming a second lower high
With two confirmed lower highs and lower lows, market structure currently favors continuation to the downside.
Trade Scenario's
Short bias:
Shorting at market offers poor R:R.
A more favorable setup would be a limit short around 523.59, within the supply zone.
Long bias:
Alternatively, price may retrace into daily demand (435.71 – 449.46), where a long setup could form if buyers step in.
Both scenarios are marked on the chart — patience and confirmation are key.
Appreciate everyone’s input. If you have a different bias, feel free to share.
Follow my journey on X: @CTucker99670
I’ll be actively posting my market bias and learning progress.
Happy trading 📊

ZEC looks short.BINANCE:ZECUSDT.P
It looks short. I would short the areas of the first liquidity accumulation on the hourly chart. I have indicated all ranges on the chart. Set a stop above the December highs.
Use your risk management (RM).

ZEC/USDT – Head & Shoulders Pullback within Rising ChannelHi!
Pattern: Head & Shoulders (short-term correction)
Trend: Overall bullish (ascending channel intact)
➡️ After forming a Head & Shoulders near the top of the channel, price saw a healthy pullback
➡️ Price is now approaching the lower boundary of the rising channel, which acts as strong dynamic support
➡️ As long as this support holds, the broader uptrend remains valid
🎯 Bullish Targets:
TP1: 520
TP2: 550
A deeper correction is possible, but buyers are expected to step in near channel support

ZECUSDT Bearish Setup on 1HRZECUSDT Bearish Setup on 1HR
- Bearish Divergence
- Rising Wedge Broken
- Alligator opened mouth towards downside on 15min TF
RR - 1:3

Key Breakout Setup: #ZEC Eyes $475-$530 RallyIn this technical analysis, I break down the current price action using a multi-timeframe approach. Starting with the 4-hour chart, I then zoom out to capture the broader market structure and identify how price recently broke above local highs before pulling back to retest that level as new support—a classic bullish confirmation pattern.
Zooming back in, I outline the critical $400 level that's keeping the near-term outlook bullish. As long as price holds above this support, we're positioned for a potential breakout toward the $475 target area, which could then open the door to the $530s.
I also cover downside risk management, including the key levels to watch that would signal weakness and potentially trigger a move to new lows. Whether you're looking for entry opportunities or managing existing positions, this video provides the technical levels you need to navigate the current setup.

ZEC/USDT - Symmetrical Triangle Before the Next Big Move?ZEC/USDT on the daily timeframe is currently showing a major consolidation phase after a strong impulsive rally. Price action is moving sideways with decreasing volatility, indicating a critical decision zone where the market is preparing for its next major move.
The overall structure clearly forms a Symmetrical Triangle, reflecting a balance between buyers and sellers.
---
Pattern Explanation
The visible pattern is a Symmetrical Triangle, characterized by:
Lower Highs (LH) forming a descending resistance line
Higher Lows (HL) forming an ascending support line
Gradually decreasing volatility during the pattern formation
This pattern is considered neutral by nature:
Upside breakout → bullish continuation
Downside breakdown → deeper correction or distribution
Since this structure forms after a strong uptrend, traders should also be cautious of potential fake breakouts.
---
Key Levels
Major Resistance:
700 – 750 USDT (previous high & strong supply zone)
Triangle Resistance:
Upper boundary of the triangle (dynamic resistance)
Triangle Support:
Lower boundary of the triangle (dynamic support)
Key Supports:
518 USDT
Psychological support zone at 440 – 460 USDT
---
Bullish Scenario
Price breaks above the upper triangle resistance with a strong daily close
Volume expansion confirms the breakout
Upside targets:
Target 1: 700 USDT
Target 2: 750 USDT (previous high)
Extended target: 850 – 900 USDT if bullish momentum continues
A valid breakout would indicate trend continuation and the beginning of a new markup phase.
---
Bearish Scenario
Price fails to break the triangle resistance
Breakdown and daily close below the triangle support
Selling pressure increases
Downside targets:
Target 1: 518 USDT
Target 2: 460 – 440 USDT
Worst case: retest of the previous demand zone below
A confirmed breakdown suggests distribution and a healthy correction before any potential long-term continuation.
---
Conclusion
ZEC/USDT is currently at a critical decision point. The Symmetrical Triangle structure signals compressed price action and stored momentum. The breakout direction will define the next major trend, making confirmation candles and volume essential before entering any position.
Patience is key — avoid entries inside the triangle and wait for confirmation.
---
#ZEC #ZECUSDT #Zcash #CryptoAnalysis #TechnicalAnalysis #SymmetricalTriangle #ChartPattern #Breakout #AltcoinAnalysis #CryptoTrading

ZECUSDT: Bearish Drop to 354?BINANCE:ZECUSDT is eyeing a bearish continuation on the 4-hour chart , with price testing the upper boundary of a descending channel after forming lower highs, converging with a potential entry zone near resistance that could spark downside momentum if sellers defend amid recent volatility. This setup suggests a pullback opportunity in the downtrend, targeting lower support levels with strong risk-reward exceeding 1:5 .🔥
Entry between 450–458 for a short position (entry from current price with proper risk management is recommended). Target at 354 . Set a stop loss at a daily close above 470 , yielding a risk-reward ratio of more than 1:5 . Monitor for confirmation via a bearish candle close below entry with rising volume, leveraging the channel's bearish bias.🌟
📝 Trade Setup
🎯 Entry (Short):
450 – 458
(Entry from current levels is valid with strict risk & position management)
🎯 Target:
• 354
❌ Stop Loss:
• Daily close above 470
⚖️ Risk-to-Reward:
• > 1:5
💡 Your view?
Does ZEC reject the channel top and flush toward 354 — or will buyers force a deeper correction?
👇 Share your thoughts below! 👇

FireHoseReel | ZEC at a Critical Range Breakout Ahead🔥 Welcome To FireHoseReel !
Let’s dive into ZCash (ZEC) analysis.
⛳️ ZEC Fundamental Overview
Zcash (ZEC) is a long-standing privacy-focused cryptocurrency, usually ranked around #16 on CoinMarketCap, enabling users to send private, non-traceable transactions with strong cryptographic privacy.
👀 ZEC 4H Overview
On the 4-hour timeframe, ZEC is trading inside a range box with resistance at $457 and support at $374. Price has reached the upper-middle area of this range, and a breakout above the range high or the midline could drive the next move toward the following resistance or support level.
📊 Volume Analysis
Zcash volume has declined over the past few days, but in the last few hours buyers have shown strength by forming a higher low. A strong volume blow-off candle has entered the market, indicating renewed buying interest.
✍️ ZEC Trading Scenarios
🟢 Long Scenario:
ZEC is currently pressing against the mentioned resistance. A breakout above this level, supported by increasing buying volume and RSI crossing above the 70 momentum threshold into overbought territory, could confirm the breakout and open the path toward the next resistance.
🔴 Short Scenario:
A breakdown below the box midline at $374, accompanied by visible selling pressure and RSI dropping below the 33 momentum zone, could trigger a move down toward the next support level.
🧠 Protect your capital first. No setup is worth blowing your account. If risk isn’t controlled, profit means nothing. Trade with rules, not emotions.

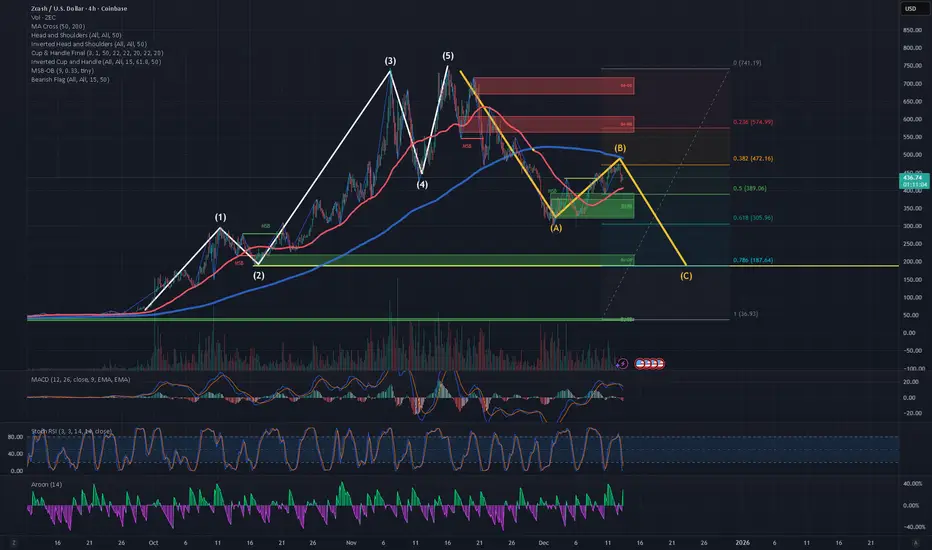
ZEC starting wave C of correctionOn the four-hour time frame, the Aroon indicator is positive and showing green because of the recent strong upward price movement. The Aroon is reflecting the impulsive advance that occurred between December 1st and December 12th, which I am interpreting as Wave B.
Prior to this, there was a clear five-wave impulsive move upward, and price now appears to be in a three-wave A–B–C corrective structure. I believe that Wave B of this corrective move is nearing completion, and that price is now beginning the decline associated with Wave C.
I believe the likelihood of further downard movement to fullfil wave C of the current three wave A-B-C structure is high, like 60 to70% based on the following reasons:
Four-hour and twelve-hour structure is corrective / weakening
Momentum (MACD) has rolled over
RSI is not resetting bullishly
Aroon suggests trend strength is fading, not expanding
Elliott interpretation of Wave B nearing completion is plausible
In theory, the chart says "down to $200", but the reality is that buyers have been very active, both humans and algorithims. It seems like any price below $400 is good buy for ZEC.
$200 represents a tail-risk scenario
$330 - 350 represents a behaviorally supported zone
In my view buyers will defend the $330 to 350 price point.
This analysis represents a probabilistic scenario rather than a guarantee, and invalidation would occur if price reclaims key resistance with expanding momentum.
This post is Not Financial Advice.
ZEC minor pull back in playZEC had a nice run up from 18 December's $383 to today's $457, and I expect a cup and handle to form, with the most likely retrace to 426.50 followed by potential wicks or pressure at $417, and $412.

ZEC Sell/Short Signal (4H)The overall trend of ZEC is clearly bearish.
A bullish move occurred to collect liquidity, and the price has now been rejected. A deep drop is expected.
We have identified two specific entry points where positions should be built using a DCA strategy. The targets have been marked on the chart.
Do not enter the position without capital management and stop setting
Comment if you have any questions
thank you

Zcash - Time to buy again!The price on the 6h timeframe is within an ascending triangle, which can be promising. If the price breaks this pattern with bullish candles, it could easily rise by the distance of AB=CD.

ZEC Sell/Short Setup (1H)Use this setup as a scalp, not a swing trade.
Since price has reacted to a major supply zone and has formed a CP pattern below the supply, a drop is expected.
Make sure to move your stop to breakeven at the first target.
The targets are clearly marked on the chart.
For risk management, please don't forget stop loss and capital management
When we reach the first target, save some profit and then change the stop to entry
Comment if you have any questions
Thank You

ZEC Sell/Short Signal (1H)Given that price has reached a higher-timeframe supply zone and is currently ranging on the 1-hour timeframe, we can look for Sell/Short positions as price approaches the supply area.
Make sure to take partial profits at the first target, then move the stop-loss to breakeven.
Do not enter the position without capital management and stop setting
Comment if you have any questions
thank you

Zcash Whales Defy Price Dip Below $400, Holdings Surge By 21%Zcash trades near $396 at the time of writing, sitting below the $403 resistance. The Parabolic SAR remains above the candlesticks, indicating the downtrend is still active. This signal reflects lingering bearish pressure despite improving on-chain and momentum indicators.
Whale accumulation and strengthening momentum could counter the technical weakness. These factors may push ZEC toward the $442 resistance. Converting this level into support would be critical. A sustained breakout could open the path toward $500, restoring broader bullish confidence.
Risks remain if momentum fails to materialize or whale behavior shifts. Continued weakness could drag ZEC toward the $340 support. A deeper sell-off may extend losses to $300 or even $260. Such a move would invalidate the bullish thesis and confirm extended downside pressure.

ZEC Update🚨📊 ZEC Update
ZEC is approaching the red resistance zone 🔴,
and this area is critical.
A breakout above could open the door
for further upside continuation.
If sellers defend this zone,
price may face another rejection.
Watching closely for confirmation. 👀

ZEC Breakdown in Play — React or Get Left BehindYello, did you see the textbook rejection right at the supply zone... or are you already late to the move?
💎#ZECUSDT just gave a clear signal, and if you're not paying close attention, this could be the start of a much deeper breakdown that catches most traders off guard.
💎After completing a clean breakdown from the rising wedge pattern, the price returned for a precise retest... and failed. The rejection right at the $400–$420 supply zone confirms it. That level was a critical resistance where bulls had their final shot to reclaim momentum — but they failed to flip the structure.
💎Now, unless ZEC rapidly reclaims the wedge breakout level, the path of least resistance is clearly down. While there’s a minor support forming near $328, it’s weak and unlikely to hold under sustained selling pressure.
💎 A drop toward the stronger support zone between $285 and $272 is where we expect a real reaction. Only a decisive reclaim above $437 would invalidate this bearish setup and suggest the bulls are back in control.
Discipline, patience, and strategy always win.
MyCryptoParadise
iFeel the success🌴

ZEC - Decision Time After Liquidity ShenanigansAlright traders, we already did the full liquidity circus —
up, down, fake moves, stop hunts…
the whole show. 🎪
Now the market actually has to decide a direction.
BTC is hanging around 90K,
which is a pretty strong resistance,
so I wouldn’t be surprised to see another dip from here.
And for ZEC?
This lines up beautifully with a head & shoulders pattern,
which could send us down toward a lower FVG.
Will it happen?
Maybe.
Will crypto troll us instead?
Also very possible. 😅
Yes, the chart looks like a complete mess —
BUT the important thing is:
I know what I’m looking at. 😂
(And honestly, that’s already a win.)
So yeah, you could just trust me and short ZEC today…
or you could be responsible and manage your risk.
Because nothing is certain at this point.
Oh —
and just to be clear:
I’m already in the trade. 😄📉
⸻
👉 BTC at resistance
👉 ZEC H&S potential
👉 FVG target below
Good luck traders — may the mess make sense today 😄📉🚀

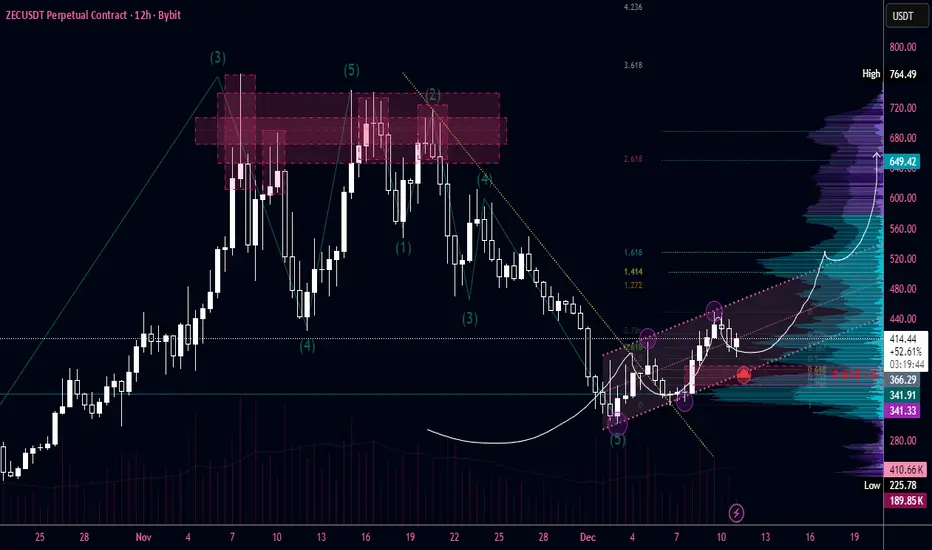
#ZEC — R:R 1:11 Target to update 765 from currentBINANCE:ZECUSDT.P
A very promising asset with a trending movement.
All assets are currently in roughly the same situation.
Here, the price has completed its wave cycle and is beginning to reverse to renew the 765 high. We cannot be sure whether it will be renewed or not.
But this is an excellent entry point to take 2 take. I am sure that the price will work out the POE level and exit the channel. The chart shows frequent touches of the channel walls.
After the resistance wall, the price is lazily moving towards its FVG, which it created through momentum. There is a break in the structure, entry from FVG 0.618 - 0.702 (exactly in the middle of FVG 12H).
Even if we don't manage to open a position, we have two targets and can open a position after the channel breaks on a retest and still have a good RR. In this trade with my POE, it is 1/11. I will be patient.
At the 1.618 - 1.272 Fibonacci level zone, there is a large HVN, followed by an equally important one at 2.618 with very strong resistance and liquidity, where the price is likely to go without difficulty.
I set small stops in such cases because I plan to go far on the price. In case of a breakout of 0.702-0.786 and the absence of a sharp impulse in the long, I would prefer not to open a position.
ZECUSD SMC Short Selling Hello traders,
ZEC has formed a corrective structure and as of right now, price is targeting the sell side liquidity zone.
This is a sell signal since we already broke structure to the down side on 1H timeframe.
Good Luck!
If you find this useful, consider a like and a comment

ZECUSDT – Short Short Short Alright boys, we’re going lower again.
Thanksgiving week = low liquidity, sleepy markets, and market makers doing whatever they want because half of Wall Street is already eating turkey.
And low liquidity means one thing:
random pump… or random dump.
In this case, I’m voting for another dump (hopefully 🤞😂).
Not much more to say — the structure looks bearish, liquidity sits below, and ZEC loves to take the elevator down.
So yeah:
• short setup on deck
• keep your stops tight
• don’t overleverage (unless you hate yourself)
• and good luck, legends 😄
👉 Manage your risk correctly — Thanksgiving dumps hit harder than normal ones.

ZECUSDT – Move Up?Alright traders, simple idea today:
I’m expecting a move up in the next few days,
nothing crazy, nothing dramatic — just a clean setup with a nice 2:1 RR on the table.
Structure looks decent, momentum isn’t dead,
and ZEC finally seems ready to do something other than trolling us. 😅
Not much more to add —
take the trade, follow your plan,
and as always:
👉 manage your risk properly
👉 don’t force it
👉 secure the bag before ZEC changes its mind 😂
Good luck, legends! 🚀📈
