ZEC USDT Spot trade | 2000% or ATH Potential in 2025 Bull MarketZEC/USDT is showing potential for a 2000% rally or reaching its ATH in the 2025 bull market. Zcash, known for its strong privacy features, could see a boost in demand as market conditions turn bullish. Technically, watch for ZEC breaking key resistance levels and holding above long-term support zones for confirmation of the trend reversal. 📈 #ZEC #Crypto #ATH"
Buy in dip and hold in spot
Zecusdtlong

ZEC/USDT - Bullish Pennant: Consolidation Before Next Breakout?ZEC/USDT on the Daily (1D) timeframe is currently in a healthy consolidation phase following a strong impulsive rally from lower levels toward the 758 USDT high. This price behavior reflects strong prior buyer dominance, followed by a cooling phase before a potential trend continuation.
---
Pattern Explanation – Bullish Pennant
The price structure clearly forms a Bullish Pennant, characterized by:
A strong flagpole created by an aggressive bullish impulse move.
A tight symmetrical consolidation with:
Lower highs
Higher lows
Decreasing volume during consolidation, which is typical for a pennant pattern.
This pattern is a bullish continuation structure, not a reversal pattern.
---
Key Levels
Key Resistance Levels:
448 USDT (minor resistance / mid-pennant area)
539 USDT (major breakout confirmation level)
697 – 758 USDT (major resistance & previous high)
Key Support Levels:
Bullish pennant lower trendline
360 USDT (structural support)
300 USDT (strong psychological support)
---
Bullish Scenario (Primary Bias)
Price holds above the lower pennant trendline.
A valid breakout above the upper pennant trendline with a strong daily close.
Additional confirmation if price breaks and holds above 539 USDT.
Bullish continuation targets:
697 USDT
Retest of 758 USDT
Further upside extension if momentum remains strong, based on the flagpole measured move.
---
Bearish Scenario (Invalidation)
Price fails to hold the lower pennant trendline.
A strong daily close below the structure confirms a failed bullish pennant.
Downside targets:
360 USDT
300 USDT
This bearish scenario represents pattern invalidation, not the primary bias.
---
Conclusion
ZEC/USDT remains in a bullish continuation phase as long as price respects the pennant structure. The market is currently at a decision zone, and a confirmed breakout could trigger the next impulsive move to the upside. Traders should wait for clear breakout confirmation before taking aggressive positions.
#ZEC #ZECUSDT #BullishPennant #CryptoAnalysis #TechnicalAnalysis #Altcoins #BullishContinuation #PriceAction #MarketStructure

ZEC / USDT Holding Key Support—Bounce Towards $472–$483 PossibleAs long as ZEC / USDT holds above the strong support zone of $313–$290, a bullish bounce towards $472–$483 remains possible. Watch this area closely and wait for clear confirmation before entering, as a breakdown below this support will invalidate the setup. Manage risk wisely.

ZEC/USDT - Symmetrical Triangle Before the Next Big Move?ZEC/USDT on the daily timeframe is currently showing a major consolidation phase after a strong impulsive rally. Price action is moving sideways with decreasing volatility, indicating a critical decision zone where the market is preparing for its next major move.
The overall structure clearly forms a Symmetrical Triangle, reflecting a balance between buyers and sellers.
---
Pattern Explanation
The visible pattern is a Symmetrical Triangle, characterized by:
Lower Highs (LH) forming a descending resistance line
Higher Lows (HL) forming an ascending support line
Gradually decreasing volatility during the pattern formation
This pattern is considered neutral by nature:
Upside breakout → bullish continuation
Downside breakdown → deeper correction or distribution
Since this structure forms after a strong uptrend, traders should also be cautious of potential fake breakouts.
---
Key Levels
Major Resistance:
700 – 750 USDT (previous high & strong supply zone)
Triangle Resistance:
Upper boundary of the triangle (dynamic resistance)
Triangle Support:
Lower boundary of the triangle (dynamic support)
Key Supports:
518 USDT
Psychological support zone at 440 – 460 USDT
---
Bullish Scenario
Price breaks above the upper triangle resistance with a strong daily close
Volume expansion confirms the breakout
Upside targets:
Target 1: 700 USDT
Target 2: 750 USDT (previous high)
Extended target: 850 – 900 USDT if bullish momentum continues
A valid breakout would indicate trend continuation and the beginning of a new markup phase.
---
Bearish Scenario
Price fails to break the triangle resistance
Breakdown and daily close below the triangle support
Selling pressure increases
Downside targets:
Target 1: 518 USDT
Target 2: 460 – 440 USDT
Worst case: retest of the previous demand zone below
A confirmed breakdown suggests distribution and a healthy correction before any potential long-term continuation.
---
Conclusion
ZEC/USDT is currently at a critical decision point. The Symmetrical Triangle structure signals compressed price action and stored momentum. The breakout direction will define the next major trend, making confirmation candles and volume essential before entering any position.
Patience is key — avoid entries inside the triangle and wait for confirmation.
---
#ZEC #ZECUSDT #Zcash #CryptoAnalysis #TechnicalAnalysis #SymmetricalTriangle #ChartPattern #Breakout #AltcoinAnalysis #CryptoTrading

ZEC Breakout in Progress? Hey friends! How’s your trading going? Hope it’s going well and profitably! 🚀
Today I’m taking a look at Zcash (ZEC).
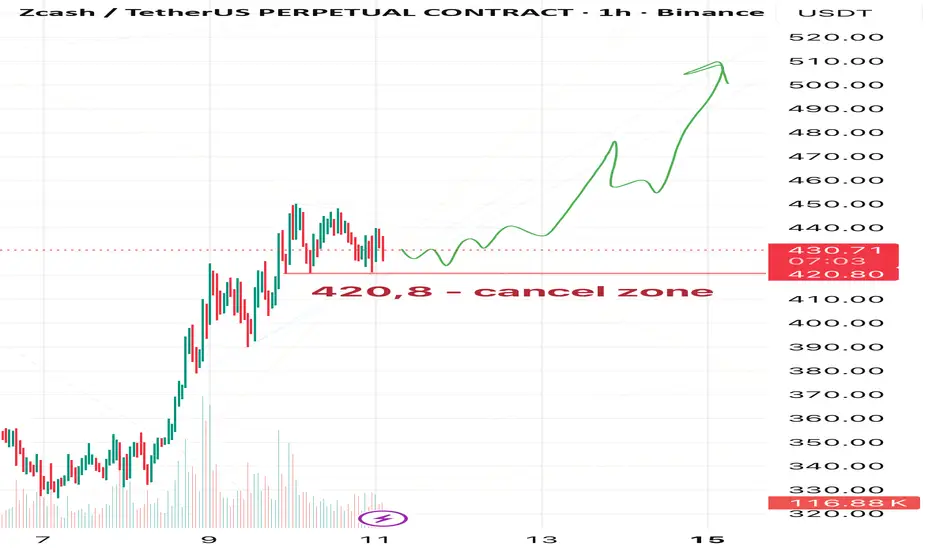
In my opinion, it looks pretty optimistic right now. I’m expecting upside from current levels.
🎯First target around 460,
🎯then 480,
and potentially 510 — but my main goal is 480 (I’ll keep 510 in parentheses for now).
❌Invalidation zone: 420.8 — if price touches this level, the plan gets canceled.
⚠️As always, this is just my personal view and not a trading signal. Trade responsibly, always use stops, and manage your risk!
Like, comment, and subscribe if you’d like to see more reviews on ZEC or other coins.
Let’s discuss in the comments — what do you think about ZEC? 📈
ZEC Weekly Outlook: Crucial Zones & Scenario BreakdownHi, friends! 👋
A brand new trading week has just begun — wishing all of you a profitable one! 💸
I’ll do my best to contribute with timely analysis and updates.
Today we’re taking a look at ZEC .
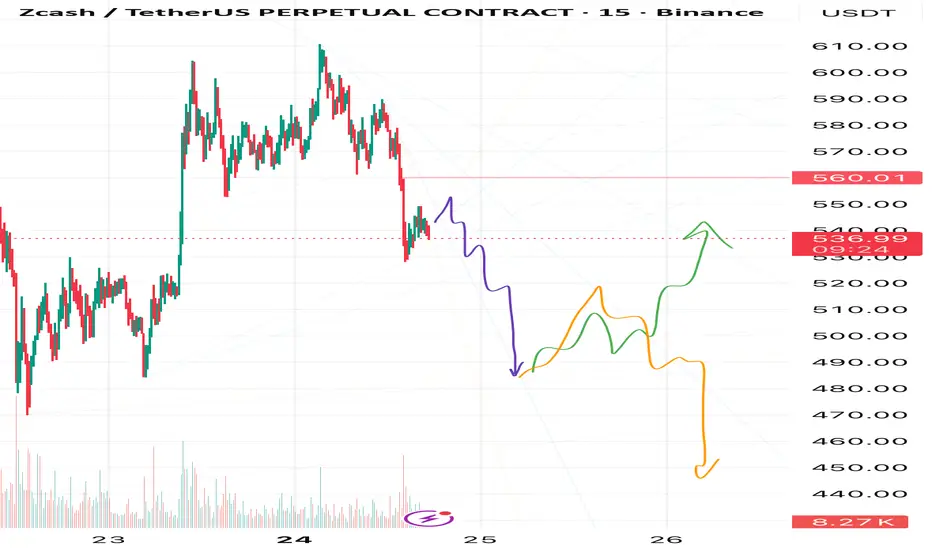
In my view, after reaching the 550–555 zone, we may see ZEC drop toward 480 .
From there, I’m considering two potential scenarios — the green and the orange arrows.
I’m personally leaning toward the orange path 🟧, but I can’t be fully confident until we see how the initial purple move plays out.
❌Also — the cancel zone for the purple scenario is at 560 . If price breaks above that level, the purple scenario becomes invalid .
As the purple scenario begins to unfold, I’ll be posting updates so you don’t miss any shifts 📈
What do you think?
Will ZEC follow the orange arrow or the green one?
And do you think ZEC will complete the initial purple move at all?
Share your thoughts in the comments — I’m genuinely interested in your view! 💬
👉 Make sure to follow and hit “Like” so you don’t miss upcoming updates!
⚠️ Disclaimer: This is not financial advice and not a call to action. This is only my personal market view. Please make decisions according to your own trading system.
Watch ZEC Supports Level Next Stops? | ZECUSDT | BTCUSDT | ZCash📊 Market Update | Zcash Key Support Levels Ahead
The price action is currently hovering near the $515 zone, which coincides with the 0.618 retracement — acting as immediate minor support.
If this level fails to hold, we could see a short-term continuation toward deeper Fibonacci zones.
🔹 Support Structure:
$515 (.618 Fib) → Minor support. Losing this could trigger a quick selloff.
$482 (.706 Fib) → First strong support area; expect buyers to test momentum here.
$454 (.786 Fib) → Secondary support; deeper correction zone if sentiment weakens further.
$385 → Major support and potential reversal zone. If price reaches this area, it could mark a long-term accumulation opportunity.
🔸 Market Outlook:
Momentum remains cautious with sellers showing dominance near resistance zones. However, watch for volume spikes or bullish divergence on lower timeframes around the $482–$454 range, as that’s where potential short-term reversal setups could emerge.
As long as $515 holds, structure remains healthy for a possible bounce. A clean breakdown below it, however, would confirm weakness and open doors toward the next supports.
🧭 Strategy:
Traders may consider scaling in gradually between $482–$454 with tight risk management, or wait for a confirmed retest above $515 for a safer re-entry.

ZECUSDTMy idea is bullish for BINANCE:ZECUSDT .
But keep 220$ support.
Next target is 290 - 370
Support: 220 - 1755 - 125 - 78
⚠️Please control risk management.

ZECUSDT – Bullish Flag Pattern: Consolidation Before Breakout?Overview
After a powerful rally that pushed ZEC from around $100 to nearly $300, the market has entered a healthy consolidation phase — forming a clean Bullish Flag Pattern on the 4H timeframe.
This pattern often represents a pause within a strong uptrend, where smart money accumulates positions quietly before the next major breakout.
As long as price remains within this downward-sloping channel (yellow zone), the structure still reflects controlled consolidation inside a broader bullish context.
---
Pattern Identification
Primary Pattern: Bullish Flag
Characteristics: A downward-sloping parallel channel following a sharp upward impulse
Technical Implication: Typically signals a continuation pattern, suggesting that the uptrend is not yet over
Confirmation: A 4H candle close above the upper boundary of the flag, supported by rising volume
---
Key Technical Levels
Upper Flag Resistance: $289 – $298
→ A breakout and 4H close above this zone confirms bullish continuation
Mid-Zone Support: $271
→ Serves as a balance level within the consolidation range
Lower Flag Support: $261
→ Acts as invalidation for the flag; a breakdown below could trigger short-term correction
---
Bullish Scenario
If ZEC breaks out above the flag and closes firmly above $298, the next leg of the rally could begin.
Confirmation: 4H close > $298 with strong bullish volume
Target 1: $320 – $340
Target 2 (Measured Move): $480 – $490, based on the length of the previous flagpole
Invalidation: 4H close back below $261
💡 Bullish Flags often lead to explosive continuation moves — once confirmed, momentum can accelerate rapidly.
---
Bearish Scenario
If price fails to hold support and breaks down below $261, it could shift into a short-term correction phase.
Confirmation: 4H close < $261
Target 1: $220 (previous demand area)
Target 2: $190
Invalidation: Close back above $289 cancels the bearish bias
---
Conclusion
ZEC is currently in a calm but critical stage — consolidating after a major impulse, with a textbook Bullish Flag forming at the top of the move.
A confirmed breakout above $289 – $298 would strongly suggest that the next bullish leg is about to unfold.
Patience and confirmation are key: true breakouts are often preceded by quiet compression like this one.
---
#ZEC #ZECUSDT #BullishFlag #CryptoAnalysis #TechnicalAnalysis #ZECBreakout #PriceAction #CryptoTrading #MarketStructure #SwingTrade #ChartPattern

ZEC: Bullish Breakout with $57 and $61 Targets AheadHello guys!
ZEC is showing some interesting technical setups right now:
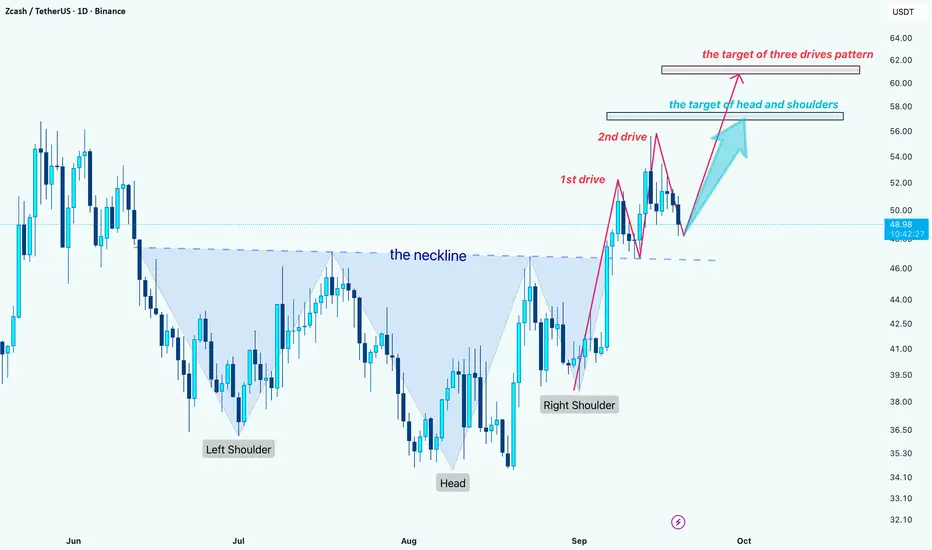
First, the chart has completed a Head & Shoulders reversal and successfully broken above the neckline. Based on this structure, the next potential upside target sits around $57.
On a lower level, the price is also shaping a Three Drives pattern. If this plays out, the extension could take ZEC higher toward the $61 zone.
Overall, the technical picture looks bullish as long as the price holds above the neckline. A breakout confirmation with momentum could push ZEC step by step toward those targets.
#ZEC/USDT Breakout Confirmed - Bullish Rally Loading!#ZEC
The price is moving within a descending channel on the 1-hour frame, adhering well to it, and is heading for a strong breakout and retest.
We have a bearish trend on the RSI indicator that is about to be broken and retested, which supports the upward breakout.
There is a major support area in green at 48.26, representing a strong support point.
For inquiries, please leave a comment.
We are in a consolidation trend above the 100 Moving Average.
Entry price: 52.70
First target: 53.70
Second target: 54.90
Third target: 56.85
Don't forget a simple matter: capital management.
When you reach the first target, save some money and then change your stop-loss order to an entry order.
For inquiries, please leave a comment.
Thank you.

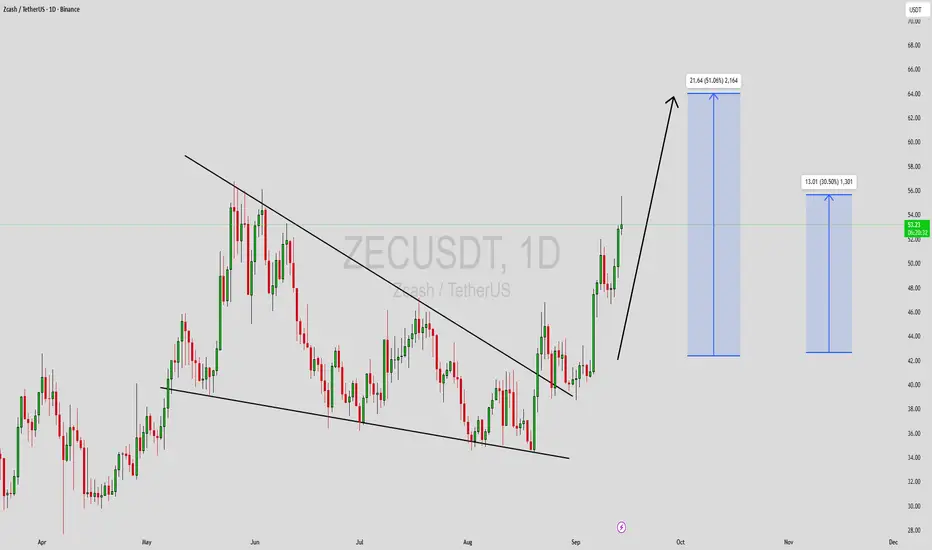
ZECUSDT Forming Falling WedgeZECUSDT has recently broken out of a falling wedge formation, a classic bullish reversal pattern that often signals strong upside potential. After weeks of consolidation, the breakout has been confirmed with solid price action and growing volume, showing that buyers are stepping in with confidence. The market structure now favors bulls, and momentum is building toward higher levels.
The projected upside suggests a potential gain of around 40% to 50%+, making ZEC one of the more attractive opportunities in the current market. As the breakout continues to unfold, traders should keep an eye on key resistance levels, as a strong push beyond them could trigger an extended rally.
Investor sentiment around Zcash is improving, and renewed interest in this project is likely to fuel further momentum. The current chart setup highlights a shift in trend that could drive price into a new bullish phase, making this pair worth watching closely.
✅ Show your support by hitting the like button and
✅ Leaving a comment below! (What is You opinion about this Coin)
Your feedback and engagement keep me inspired to share more insightful market analysis with you!
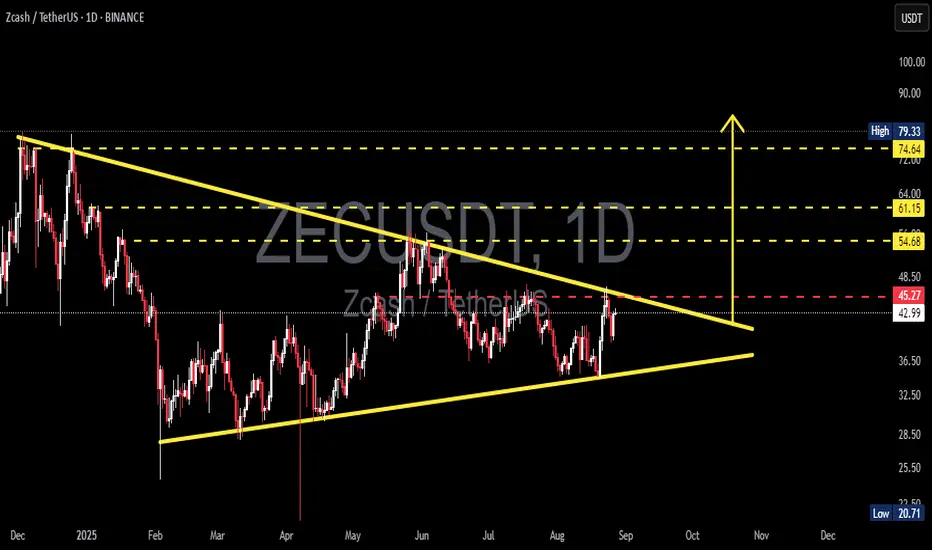
ZEC/USDT — Symmetrical Triangle: A Big Breakout?🔎 Pattern Analysis
On the daily chart, ZEC/USDT is forming a symmetrical triangle. This structure is characterized by:
Lower Highs → sellers continue to defend lower levels (descending resistance).
Higher Lows → buyers step in earlier each time (ascending support).
Both lines are converging, compressing volatility, and signaling that a major move is imminent. The apex of this triangle is projected around late September to early October 2025, meaning a breakout (up or down) is likely to occur before then.
---
📈 Bullish Scenario (Upside Breakout)
If ZEC manages to break and close above 45–48 (red dashed line + descending resistance), especially with rising volume, it would confirm a bullish breakout.
➡️ Potential upside targets:
🎯 Target 1: 54.68 (+27%)
🎯 Target 2: 61.15 (+42%)
🎯 Target 3: 74.64 (+73%)
Such a breakout often sparks sustained rallies, especially if the broader crypto market sentiment aligns.
---
📉 Bearish Scenario (Downside Breakdown)
If ZEC fails to break resistance and instead closes below ~36.50 (ascending support), downside momentum could accelerate.
➡️ Potential downside targets:
🎯 Target 1: 36.50 (first support, −15%)
🎯 Target 2: 32.50 (major support, −24%)
🎯 Target 3: 20.71 (historical low, −52%)
This would indicate weakness and could open the door for deeper declines toward multi-month lows.
---
⚖️ Key Takeaways
The symmetrical triangle is a neutral but powerful pattern → direction will depend on the breakout.
Always wait for confirmation (daily close + volume spike) before committing.
Beware of false breakouts — a retest of the breakout zone is often a safer entry.
Risk management is crucial: protect capital with stop-loss and proper position sizing.
👉 In short: ZEC is approaching a make-or-break moment. Breakout to the upside could fuel a strong rally, while a breakdown could trigger heavy selling pressure.
#ZECUSDT #Zcash #CryptoAnalysis #Breakout #SymmetricalTriangle #Altcoins #TechnicalAnalysis #PriceAction
ZECUSDT Breakout Confirmed - Bullish Rally Loading!BINANCE:ZECUSDT has officially broken above a strong horizontal resistance zone that had been acting as a ceiling for several weeks. The 4H chart clearly shows a breakout with strong bullish candles and consolidation just above the breakout level. a classic bullish retest structure.
This resistance zone had been tested multiple times in the past, making the breakout even more significant. What’s more promising is the clean shift from a range-bound structure to higher highs, supported by a well-defined base of accumulation at the lower support level.
Stay sharp, always manage your risk, and don’t forget to set a proper stop loss. The trend is strong, and momentum is building!
BINANCE:ZECUSDT Currently trading at $44
Buy level : Above $44
Stop loss : Below $39.5
Target 1: $47
Target 2: $53
Target 3: $60
Max leverage 5x
Always keep stop loss
Follow Our Tradingview Account for More Technical Analysis Updates, | Like, Share and Comment Your thoughts

ZECUSDT 1WZEC ~ 1W Analysis
#ZEC Buy gradually from here if you still have a Conviction on this coin with a short -term target of at least 20%+.

#ZEC/USDT#ZEC
The price is moving in a descending channel on the 1-hour frame and is expected to continue upward.
We have a trend to stabilize above the 100 moving average once again.
We have a downtrend on the RSI indicator that supports the upward move with a breakout.
We have a support area at the lower boundary of the channel at 37.40.
Entry price: 37.90
First target: 38.82
Second target: 40
Third target: 41

Long ZecusdtEntered leverged DCA long here with tight stoploss.
Risky entry but high RR.
Entered under 36 with flat and tight Sl at 35.
Rejection here can send it higher and slightly higher can trigger high TF long scenario.
Can hold for swing if pumped from here.
Note: Not a Financial Advise.

ZECUSDT 1WZEC ~ 1W Analysis
#ZEC So far it still maintains its bullish structure. Buy from here if you still have a Conviction on this coin with a minimum target of 20%+.

ZECUSDT 1WZEC ~ 1W Analysis
#ZEC This is the lowest support for now. Buy gradually from here if you still have a Conviction on this Coin with a minimum target of 20%+

ZECUSDT: What the Market Is Whispering About Today - Zcash◳◱ On the BINANCE:ZECUSDT chart, the Super Trend pattern suggests a pause in volatility, potentially gearing up for a breakout. Traders might observe resistance around 66.05 | 73.53 | 93.48 and support near 46.1 | 33.63 | 13.68. Entering trades at 59.68 could be strategic, aiming for the next resistance level.
◰◲ General Information :
▣ Name: Zcash
▣ Rank: 121
▣ Exchanges: Binance, Kucoin, Huobipro, Gateio, Mexc, Hitbtc
▣ Category / Sector: Payments - Currencies
▣ Overview: Zcash is a privacy-preserving cryptocurrency providing anonymous value transfer using zero-knowledge cryptography. The protocol provides the option for transactions to be either shielded, in which case they will be completely anonymous, or transparent, in which case they will be visible on the Zcash blockchain. Zcash pays out a portion of its block rewards, called the "Founder's Reward", to fund protocol development. It currently allocates the Founder's Reward to the Electric Coin Company and the Zcash Foundation who develop and steward the Zcash protocol respectively.
◰◲ Technical Metrics :
▣ Current Price: 59.68 ₮
▣ 24H Volume: 26,131,359.620 ₮
▣ 24H Change: 8.786%
▣ Weekly Change: 4.11%%
▣ Monthly Change: 23.08%%
▣ Quarterly Change: 106.32%%
◲◰ Pivot Points :
▣ Resistance Level: 66.05 | 73.53 | 93.48
▣ Support Level: 46.1 | 33.63 | 13.68
◱◳ Indicator Recommendations :
▣ Oscillators: SELL
▣ Moving Averages: STRONG_BUY
◰◲ Summary of Technical Indicators : BUY
◲◰ Sharpe Ratios :
▣ Last 30 Days: 2.32
▣ Last 90 Days: 2.64
▣ Last Year: 1.06
▣ Last 3 Years: 0.01
◲◰ Volatility Analysis :
▣ Last 30 Days: 1.50
▣ Last 90 Days: 1.17
▣ Last Year: 0.94
▣ Last 3 Years: 0.88
◳◰ Market Sentiment :
▣ News Sentiment: N/A
▣ Twitter Sentiment: N/A
▣ Reddit Sentiment: N/A
▣ In-depth BINANCE:ZECUSDT analysis available at TradingView TA Page
▣ Your thoughts matter! What do you think of this analysis? Share your insights in the comments below. Your like, follow, and support are greatly valued and help sustain high-quality content.
◲ Disclaimer : Disclaimer
The content provided is for informational purposes only and does not constitute financial, investment, or trading advice. Always conduct your own research and consult a qualified professional before making any financial decisions. Use of the information is solely at your own risk.
▣ Explore the Power of Charting with TradingView
Unlock a wide range of financial analysis tools, data, and features to elevate your trading experience. Take a tour and see the possibilities. If you decide to upgrade your plan, you can receive up to $30 back. Discover more here - affiliate link -

$ZECUSDT : Privacy Coin Ready to Rally?BINANCE:ZECUSDT , a leading privacy-focused cryptocurrency, has demonstrated a strong rebound following a recent market downturn. This resilience has captured the attention of the crypto community, sparking renewed interest in the coin. Technically, BYBIT:ZECUSDT.P has exhibited a pattern of overcoming resistance levels, forming higher highs, and suggesting a bullish trajectory. The current resistance at $80 is a critical hurdle. A successful breach of this level could potentially unleash significant upward momentum. Traders are advised to exercise prudent risk management practices, including setting stop-loss orders, to mitigate potential losses.
COINBASE:ZECUSD Currently trading at $53
Buy level: Above $44
Stop loss: Below $34
Target : $200
Max Leverage 3x
Always keep Stop loss
Follow Our Tradingview Account for More Technical Analysis Updates, | Like, Share and Comment Your thoughts

ZECUSDT Hits All Targets – 940% Profit Secured at 10x!ZECUSDT on the 1-Day timeframe delivered an outstanding long trade setup, smashing all profit targets and securing a remarkable 940% profit at 10x leverage.
Key Levels:
TP1: 41.78 ✅
TP2: 52.53 ✅
TP3: 63.28 ✅
TP4: 69.93 ✅
Technical Analysis:
The trade was perfectly executed using the Risological Swing Trading Indicator , which provided a clean entry at 35.14 with an SL at 29.77. ZECUSDT displayed strong upward momentum, supported by a clear price crossover above the Risological Trend Line, leading to a sustained uptrend. All targets were hit with precision, delivering massive gains.

#ZEC/USDT#ZEC
The price is moving in a descending channel on a 3-day frame and is sticking to it well
We have a bounce from the lower limit of the descending channel and we are now touching this support at a price of 24
We have a downtrend on the RSI indicator that is about to be broken, which supports the rise
We have a trend to stabilize above the moving average 100
Entry price 31
First target 43
Second target 56
Third target 73
