Check if it can rise above 422.80
Hello? Hello, traders.
If you "Follow" us, you'll always get the latest information quickly.
Have a great day.
-------------------------------------
(ZECUSDT 1D Chart)
After a sharp rise, the price is showing a sharp decline.
The key to a bullish turn is whether the price can rise above 422.80 and hold.
If the uptrend fails, we need to check for support around 216.60.
If it falls below 216.60, it's likely to take time to rise again.
Although the price is showing a short-term downtrend, falling below the M-Signal indicator on the 1D chart, it should be considered an ongoing uptrend because the M-Signal indicator on the 1D chart > M-Signal on the 1W chart > M-Signal on the 1M chart is arranged in this order.
Therefore, if the M-Signal indicator on the 1W chart declines, consider whether it can find support near the M-Signal indicator on the 1M chart and consider a response plan.
Therefore, the movement when the price falls to around 216.60 is crucial.
There is a possibility that the price will rise above the OBV High indicator, sustaining the price and indicating further upward movement.
However, since the OBV Low indicator is still above the OBV High indicator, a sideways movement seems likely.
-
Thank you for reading to the end.
We wish you successful trading.
--------------------------------------------------
ZECUSDTPERP

#ZEC/USDT – Potential Long Setup at Key Fibonacci Level#ZEC
The price is moving in a descending channel on the 1-hour timeframe. It has reached the lower boundary and is heading towards breaking above it, with a retest of the upper boundary expected.
We have a downtrend on the RSI indicator, which has reached near the lower boundary, and an upward rebound is expected.
There is a key support zone in green at 296. The price has bounced from this zone multiple times and is expected to bounce again.
We have a trend towards stability above the 100-period moving average, as we are moving close to it, which supports the upward move.
Entry price: 334
First target: 352
Second target: 386
Third target: 430
Don't forget a simple principle: money management.
Place your stop-loss below the support zone in green.
For any questions, please leave a comment.
Thank you.

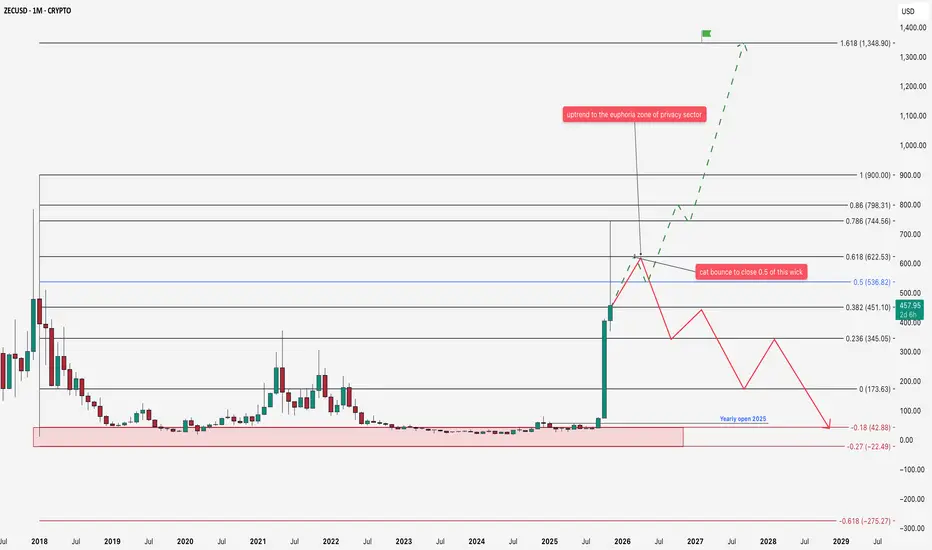
ZEC and point of decision As usual, retail investors and traders start hyping a trend only after the upward pump has already happened! Back in 2023, nobody gave a damn about CRYPTO:ZECUSD or privacy-sector tokens!
Now everyone's suddenly an expert, flooding charts with talk of insane potential and how this category's just getting started! But I think all these rumors are already baked into the price, like always!
The accumulation zone is marked down low—that zone has been, still is, and always will be the sweet spot for scooping up Zcash!
Right now, hitting exactly the 0.78 Fibonacci extension (yeah, this analysis is pretty basic), we're seeing a reaction, and it's totally normal after such a sharp rally!
Next up: a tricky decision zone! Even if Bitcoin dominance drops below 50%, no guarantee ZEC keeps climbing!
If it does push on and we hit that full-on euphoria phase in alts, I figure the target flagged here will mark the logical cycle top!
But if the pump's already done its thing and liquidity rotates to other sectors? Then we could see at least a retrace to wick out that 50% level before heading back down the long, painful road for the next 2-3 years straight to the accumulation zone again!
Thanks for support!
✅Disclaimer: Please be aware of the risks involved in trading. This idea was made for educational purposes only not for financial Investment Purposes.
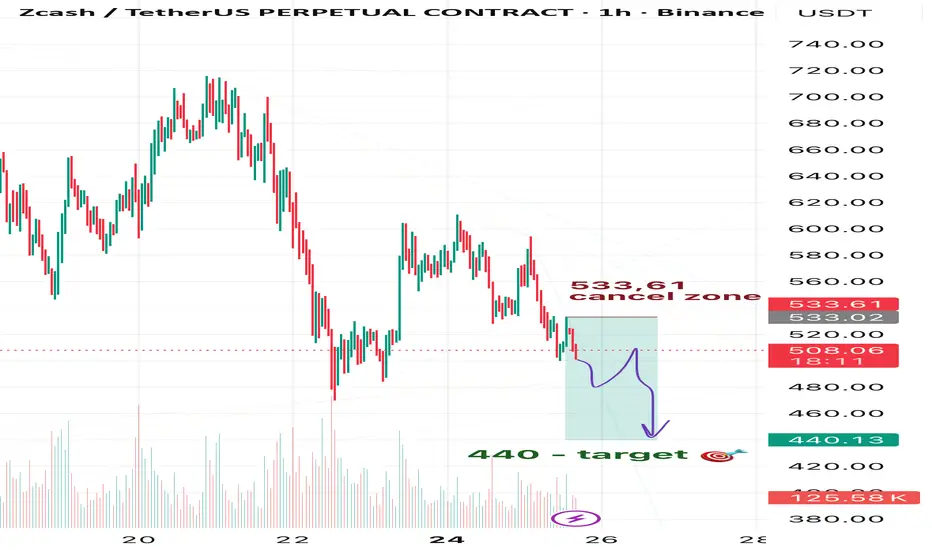
ZEC: Downside Scenario Still in PlayHi, friends! 👋
Yesterday, ZEC broke through my scenario invalidation zone. Earlier, I shared an idea expecting ZEC to move toward 480 and lower. Despite this breakout, the broader bearish setup is not invalidated — in fact, ZEC has only confirmed its intention to continue downward 📉
My targets:
🎯 Target 1: 480
🎯 Target 2: 460
🎯 Target 3: 440
❌ Plan invalidation zone: 533.61
Watch ZEC Supports Level Next Stops? | ZECUSDT | BTCUSDT | ZCash📊 Market Update | Zcash Key Support Levels Ahead
The price action is currently hovering near the $515 zone, which coincides with the 0.618 retracement — acting as immediate minor support.
If this level fails to hold, we could see a short-term continuation toward deeper Fibonacci zones.
🔹 Support Structure:
$515 (.618 Fib) → Minor support. Losing this could trigger a quick selloff.
$482 (.706 Fib) → First strong support area; expect buyers to test momentum here.
$454 (.786 Fib) → Secondary support; deeper correction zone if sentiment weakens further.
$385 → Major support and potential reversal zone. If price reaches this area, it could mark a long-term accumulation opportunity.
🔸 Market Outlook:
Momentum remains cautious with sellers showing dominance near resistance zones. However, watch for volume spikes or bullish divergence on lower timeframes around the $482–$454 range, as that’s where potential short-term reversal setups could emerge.
As long as $515 holds, structure remains healthy for a possible bounce. A clean breakdown below it, however, would confirm weakness and open doors toward the next supports.
🧭 Strategy:
Traders may consider scaling in gradually between $482–$454 with tight risk management, or wait for a confirmed retest above $515 for a safer re-entry.

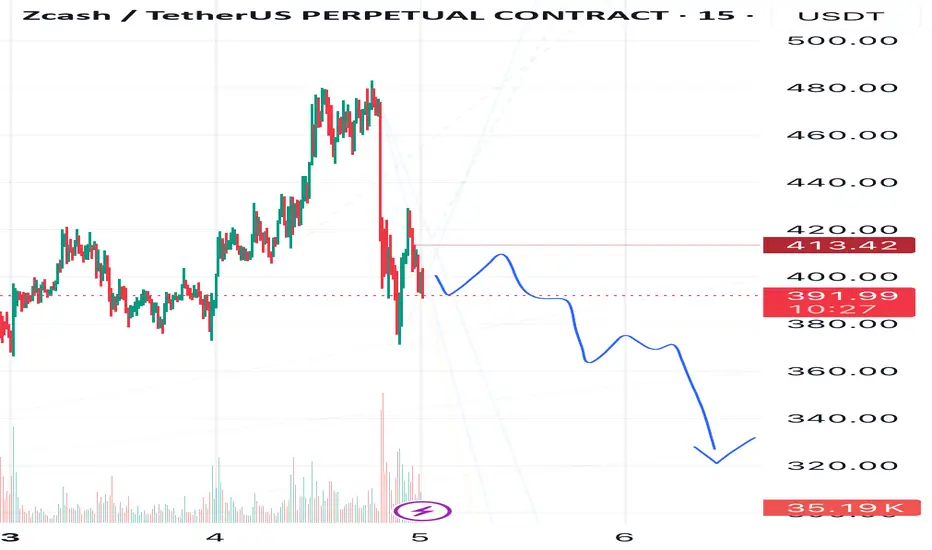
ZEC on Deck — Time to CorrectZEC finally decided to correct after its unstoppable rally.
I’m expecting it to reach 330 and lower — time to cool down before the next leg up 😌
ZEC also looks ready for a correction since Bitcoin still looks bearish globally, which could put additional pressure on altcoins.
❌ Plan invalidation level: 413.42
⚠️ Disclaimer:
This is not financial advice or a trading signal.
Always make your own decisions and never trade without a stop-loss.
ZEC on Deck — Correction CheckI expect a correction on ZECUSDT.
My downside targets are:
1️⃣ 210
2️⃣ 188
3️⃣ 156
The invalidation zone is marked in red on the chart.

Check if 224.47-260.42 can be supported
Hello, fellow traders!
If you "Follow" us, you'll always get the latest information quickly.
Have a great day.
-------------------------------------
(ZECUSDT 1M chart)
You might be wondering why it's rising, but you don't need to know why.
Because it's already rising.
It's a sharp rise, breaking above the important support and resistance area of 56.29-78.91.
The key is whether the price can hold above the Fibonacci 1.618 (338.52) level.
If not, we need to check for support near 220.20, the previous DOM (60) indicator level.
Since the chart was broken by a surge, I believe the next support period is crucial.
-
(1W chart)
The next volatility period is expected to be November 3-23, around the week of November 10.
-
(1D chart)
As mentioned earlier, since the chart was broken by a surge, I think we can calculate the next volatility period based on the next support period.
Until then, we need to see how the price moves after this volatility period, which runs around October 21 (October 20-22).
Looking at the current 1D chart, the HA-High ~ DOM(60) range is forming between 224.47 and 260.42. Therefore, we need to see if it can find support within this range and rise.
If it falls below 220.20, it could fall to around 115.72, so we should consider a response plan.
-
Thank you for reading to the end.
I wish you successful trading.
--------------------------------------------------

ZECUSDT – Bullish Flag Pattern: Consolidation Before Breakout?Overview
After a powerful rally that pushed ZEC from around $100 to nearly $300, the market has entered a healthy consolidation phase — forming a clean Bullish Flag Pattern on the 4H timeframe.
This pattern often represents a pause within a strong uptrend, where smart money accumulates positions quietly before the next major breakout.
As long as price remains within this downward-sloping channel (yellow zone), the structure still reflects controlled consolidation inside a broader bullish context.
---
Pattern Identification
Primary Pattern: Bullish Flag
Characteristics: A downward-sloping parallel channel following a sharp upward impulse
Technical Implication: Typically signals a continuation pattern, suggesting that the uptrend is not yet over
Confirmation: A 4H candle close above the upper boundary of the flag, supported by rising volume
---
Key Technical Levels
Upper Flag Resistance: $289 – $298
→ A breakout and 4H close above this zone confirms bullish continuation
Mid-Zone Support: $271
→ Serves as a balance level within the consolidation range
Lower Flag Support: $261
→ Acts as invalidation for the flag; a breakdown below could trigger short-term correction
---
Bullish Scenario
If ZEC breaks out above the flag and closes firmly above $298, the next leg of the rally could begin.
Confirmation: 4H close > $298 with strong bullish volume
Target 1: $320 – $340
Target 2 (Measured Move): $480 – $490, based on the length of the previous flagpole
Invalidation: 4H close back below $261
💡 Bullish Flags often lead to explosive continuation moves — once confirmed, momentum can accelerate rapidly.
---
Bearish Scenario
If price fails to hold support and breaks down below $261, it could shift into a short-term correction phase.
Confirmation: 4H close < $261
Target 1: $220 (previous demand area)
Target 2: $190
Invalidation: Close back above $289 cancels the bearish bias
---
Conclusion
ZEC is currently in a calm but critical stage — consolidating after a major impulse, with a textbook Bullish Flag forming at the top of the move.
A confirmed breakout above $289 – $298 would strongly suggest that the next bullish leg is about to unfold.
Patience and confirmation are key: true breakouts are often preceded by quiet compression like this one.
---
#ZEC #ZECUSDT #BullishFlag #CryptoAnalysis #TechnicalAnalysis #ZECBreakout #PriceAction #CryptoTrading #MarketStructure #SwingTrade #ChartPattern

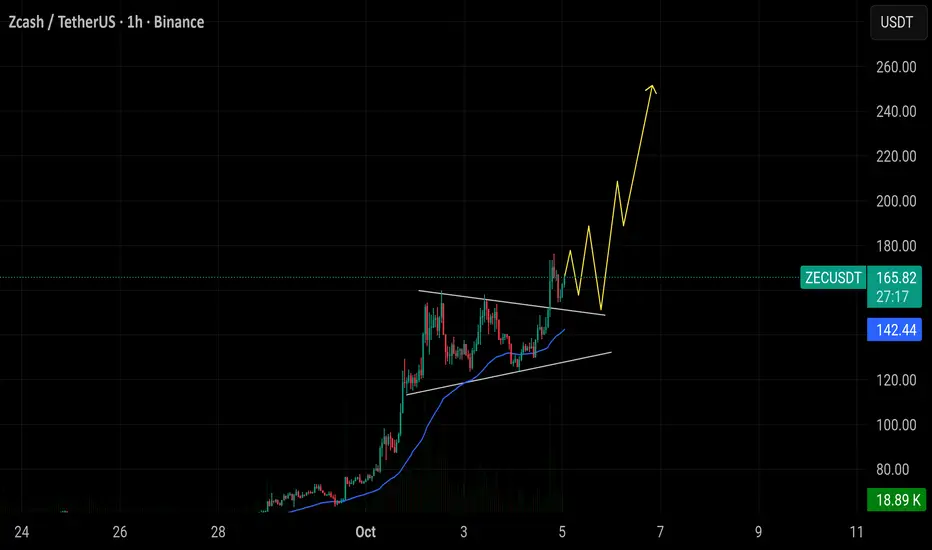
$ZEC/USDT has broken out of its wedge pattern and is currently $ZEC/USDT has broken out of its wedge pattern and is currently trading near 164. If price holds above 150, momentum could continue toward the 200–240 zone. The lower trendline support around 130 remains the key level to maintain the overall bullish structure.
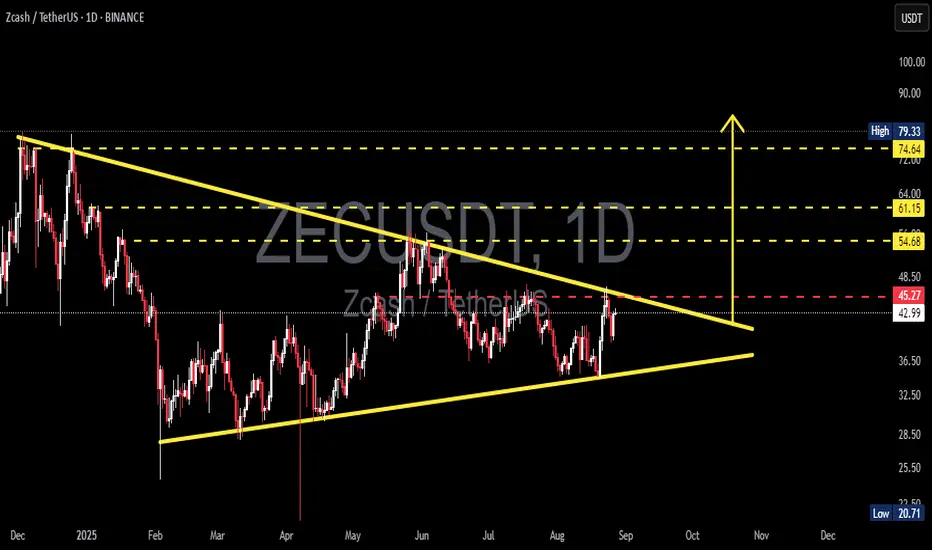
ZEC/USDT — Symmetrical Triangle: A Big Breakout?🔎 Pattern Analysis
On the daily chart, ZEC/USDT is forming a symmetrical triangle. This structure is characterized by:
Lower Highs → sellers continue to defend lower levels (descending resistance).
Higher Lows → buyers step in earlier each time (ascending support).
Both lines are converging, compressing volatility, and signaling that a major move is imminent. The apex of this triangle is projected around late September to early October 2025, meaning a breakout (up or down) is likely to occur before then.
---
📈 Bullish Scenario (Upside Breakout)
If ZEC manages to break and close above 45–48 (red dashed line + descending resistance), especially with rising volume, it would confirm a bullish breakout.
➡️ Potential upside targets:
🎯 Target 1: 54.68 (+27%)
🎯 Target 2: 61.15 (+42%)
🎯 Target 3: 74.64 (+73%)
Such a breakout often sparks sustained rallies, especially if the broader crypto market sentiment aligns.
---
📉 Bearish Scenario (Downside Breakdown)
If ZEC fails to break resistance and instead closes below ~36.50 (ascending support), downside momentum could accelerate.
➡️ Potential downside targets:
🎯 Target 1: 36.50 (first support, −15%)
🎯 Target 2: 32.50 (major support, −24%)
🎯 Target 3: 20.71 (historical low, −52%)
This would indicate weakness and could open the door for deeper declines toward multi-month lows.
---
⚖️ Key Takeaways
The symmetrical triangle is a neutral but powerful pattern → direction will depend on the breakout.
Always wait for confirmation (daily close + volume spike) before committing.
Beware of false breakouts — a retest of the breakout zone is often a safer entry.
Risk management is crucial: protect capital with stop-loss and proper position sizing.
👉 In short: ZEC is approaching a make-or-break moment. Breakout to the upside could fuel a strong rally, while a breakdown could trigger heavy selling pressure.
#ZECUSDT #Zcash #CryptoAnalysis #Breakout #SymmetricalTriangle #Altcoins #TechnicalAnalysis #PriceAction
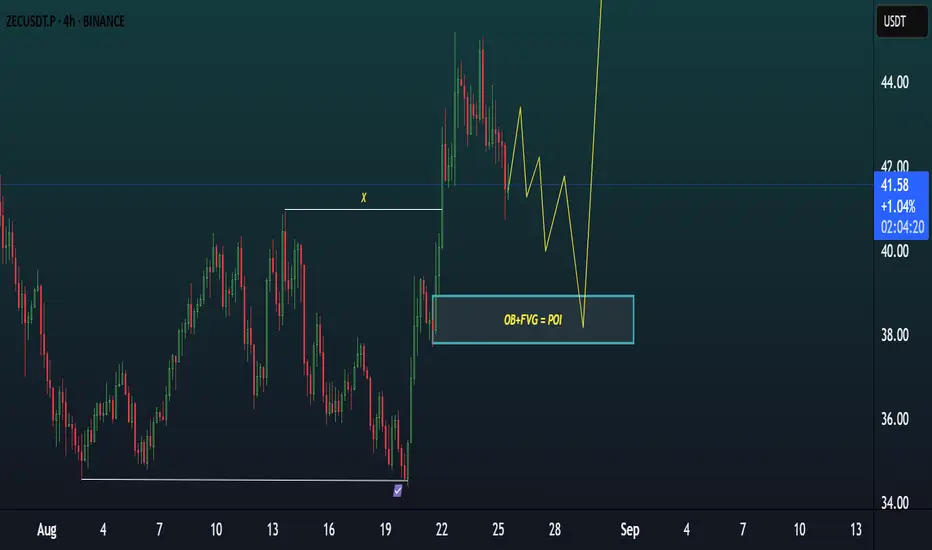
ZECUSDT TRADE IDEA.ZECUSDT | 4H Bullish Setup
🔑 Key Structure: Bullish BOS confirmed, liquidity sweep done.
🟦 POI Level: OB + FVG confluence around $38–39 (strong demand zone).
📉 Current Price: 41.5 — pulling back after recent rally.
📊 Trade Plan: Expect retrace into demand zone before bullish continuation. Watch for confirmation entry.
🎯 Targets: $44 – $46 (short-term), higher if momentum sustains.
❌ Invalidation: Clean 4H close below $37.8 demand zone.
The key is whether it can find support near 44.46 and rise
Hello, fellow traders.
Follow us to get the latest information quickly.
Have a great day.
-------------------------------------
(ZECUSDT 1M chart)
It appears to have broken away from the long-term downtrend line (1).
However, to initiate an uptrend, the price must remain above the M-Signal indicator on the 1M chart.
The key is whether the price can rise above 56.29 and hold its value.
-
(1D chart)
The key is whether the price can find support around 44.46 and rise above 49.89-56.29.
To achieve this, we need to see whether the price remains above the M-Signal indicator on the 1M chart after the volatility period around September 1st.
If it fails and falls, we need to check for support near the first and second levels above:
1st: 37.69
2nd: 31.08-33.69
- Thank you for reading.
We wish you successful trading.
--------------------------------------------------
- This is an explanation of the big picture.
(3-Year Bull Market, 1-Year Bear Market Pattern)
I will explain more in detail when the bear market begins.
------------------------------------------------------

ZECUSDT Breakout Confirmed - Bullish Rally Loading!BINANCE:ZECUSDT has officially broken above a strong horizontal resistance zone that had been acting as a ceiling for several weeks. The 4H chart clearly shows a breakout with strong bullish candles and consolidation just above the breakout level. a classic bullish retest structure.
This resistance zone had been tested multiple times in the past, making the breakout even more significant. What’s more promising is the clean shift from a range-bound structure to higher highs, supported by a well-defined base of accumulation at the lower support level.
Stay sharp, always manage your risk, and don’t forget to set a proper stop loss. The trend is strong, and momentum is building!
BINANCE:ZECUSDT Currently trading at $44
Buy level : Above $44
Stop loss : Below $39.5
Target 1: $47
Target 2: $53
Target 3: $60
Max leverage 5x
Always keep stop loss
Follow Our Tradingview Account for More Technical Analysis Updates, | Like, Share and Comment Your thoughts

ZECUSDT 1WZEC ~ 1W Analysis
#ZEC Buy gradually from here if you still have a Conviction on this coin with a short -term target of at least 20%+.

Long ZecusdtEntered leverged DCA long here with tight stoploss.
Risky entry but high RR.
Entered under 36 with flat and tight Sl at 35.
Rejection here can send it higher and slightly higher can trigger high TF long scenario.
Can hold for swing if pumped from here.
Note: Not a Financial Advise.

ZECUSDT 1WZEC ~ 1W Analysis
#ZEC So far it still maintains its bullish structure. Buy from here if you still have a Conviction on this coin with a minimum target of 20%+.

ZECUSDT 1WZEC ~ 1W Analysis
#ZEC This is the lowest support for now. Buy gradually from here if you still have a Conviction on this Coin with a minimum target of 20%+

$ZECUSDT : Privacy Coin Ready to Rally?BINANCE:ZECUSDT , a leading privacy-focused cryptocurrency, has demonstrated a strong rebound following a recent market downturn. This resilience has captured the attention of the crypto community, sparking renewed interest in the coin. Technically, BYBIT:ZECUSDT.P has exhibited a pattern of overcoming resistance levels, forming higher highs, and suggesting a bullish trajectory. The current resistance at $80 is a critical hurdle. A successful breach of this level could potentially unleash significant upward momentum. Traders are advised to exercise prudent risk management practices, including setting stop-loss orders, to mitigate potential losses.
COINBASE:ZECUSD Currently trading at $53
Buy level: Above $44
Stop loss: Below $34
Target : $200
Max Leverage 3x
Always keep Stop loss
Follow Our Tradingview Account for More Technical Analysis Updates, | Like, Share and Comment Your thoughts

Zecusdt Swing LongAdded to swing long under 28.85 stops at clean breaking below 28.
Holding here can trigger a huge fast move.
Tp 60+
Note: Not a Financial

ZECUSDT Broadening Wedge PatternZECUSDT technical analysis update
ZEC has been forming a broadening wedge pattern for the last 450 days. The price is now moving towards the wedge's resistance for a potential breakout, and it is trading above the 100 and 200 EMAs on the daily chart. If a breakout occurs, we can expect a strong bullish move.
Buy Level: $33.00
Stop loss: $25.00

Rescue ZECusdtLonging Zecusdt one last time.
Rejection needed.
Entered into long 21.03
Flat Stoploss at 20.70
Will close if holds below 21.85.
Targeting 24 and 28.
Note: Not a Financial Advice.

ZECUSDTZcash (Zec) has successfully broken out, marked by a confirmed ✅. The current price is undergoing a pullback, presenting a potential buying opportunity around $29.30. If the price rebounds from this level, the target could be set at $31.
