ZECUSDT – Bullish Flag Pattern: Consolidation Before Breakout?Overview
After a powerful rally that pushed ZEC from around $100 to nearly $300, the market has entered a healthy consolidation phase — forming a clean Bullish Flag Pattern on the 4H timeframe.
This pattern often represents a pause within a strong uptrend, where smart money accumulates positions quietly before the next major breakout.
As long as price remains within this downward-sloping channel (yellow zone), the structure still reflects controlled consolidation inside a broader bullish context.
---
Pattern Identification
Primary Pattern: Bullish Flag
Characteristics: A downward-sloping parallel channel following a sharp upward impulse
Technical Implication: Typically signals a continuation pattern, suggesting that the uptrend is not yet over
Confirmation: A 4H candle close above the upper boundary of the flag, supported by rising volume
---
Key Technical Levels
Upper Flag Resistance: $289 – $298
→ A breakout and 4H close above this zone confirms bullish continuation
Mid-Zone Support: $271
→ Serves as a balance level within the consolidation range
Lower Flag Support: $261
→ Acts as invalidation for the flag; a breakdown below could trigger short-term correction
---
Bullish Scenario
If ZEC breaks out above the flag and closes firmly above $298, the next leg of the rally could begin.
Confirmation: 4H close > $298 with strong bullish volume
Target 1: $320 – $340
Target 2 (Measured Move): $480 – $490, based on the length of the previous flagpole
Invalidation: 4H close back below $261
💡 Bullish Flags often lead to explosive continuation moves — once confirmed, momentum can accelerate rapidly.
---
Bearish Scenario
If price fails to hold support and breaks down below $261, it could shift into a short-term correction phase.
Confirmation: 4H close < $261
Target 1: $220 (previous demand area)
Target 2: $190
Invalidation: Close back above $289 cancels the bearish bias
---
Conclusion
ZEC is currently in a calm but critical stage — consolidating after a major impulse, with a textbook Bullish Flag forming at the top of the move.
A confirmed breakout above $289 – $298 would strongly suggest that the next bullish leg is about to unfold.
Patience and confirmation are key: true breakouts are often preceded by quiet compression like this one.
---
#ZEC #ZECUSDT #BullishFlag #CryptoAnalysis #TechnicalAnalysis #ZECBreakout #PriceAction #CryptoTrading #MarketStructure #SwingTrade #ChartPattern
Zecusdtsignal

ZEC/USDT — Symmetrical Triangle: A Big Breakout?🔎 Pattern Analysis
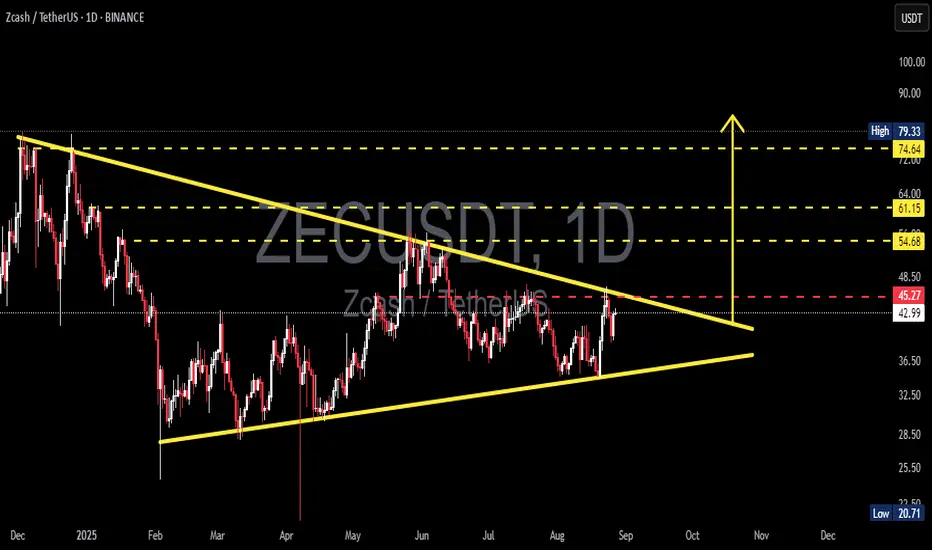
On the daily chart, ZEC/USDT is forming a symmetrical triangle. This structure is characterized by:
Lower Highs → sellers continue to defend lower levels (descending resistance).
Higher Lows → buyers step in earlier each time (ascending support).
Both lines are converging, compressing volatility, and signaling that a major move is imminent. The apex of this triangle is projected around late September to early October 2025, meaning a breakout (up or down) is likely to occur before then.
---
📈 Bullish Scenario (Upside Breakout)
If ZEC manages to break and close above 45–48 (red dashed line + descending resistance), especially with rising volume, it would confirm a bullish breakout.
➡️ Potential upside targets:
🎯 Target 1: 54.68 (+27%)
🎯 Target 2: 61.15 (+42%)
🎯 Target 3: 74.64 (+73%)
Such a breakout often sparks sustained rallies, especially if the broader crypto market sentiment aligns.
---
📉 Bearish Scenario (Downside Breakdown)
If ZEC fails to break resistance and instead closes below ~36.50 (ascending support), downside momentum could accelerate.
➡️ Potential downside targets:
🎯 Target 1: 36.50 (first support, −15%)
🎯 Target 2: 32.50 (major support, −24%)
🎯 Target 3: 20.71 (historical low, −52%)
This would indicate weakness and could open the door for deeper declines toward multi-month lows.
---
⚖️ Key Takeaways
The symmetrical triangle is a neutral but powerful pattern → direction will depend on the breakout.
Always wait for confirmation (daily close + volume spike) before committing.
Beware of false breakouts — a retest of the breakout zone is often a safer entry.
Risk management is crucial: protect capital with stop-loss and proper position sizing.
👉 In short: ZEC is approaching a make-or-break moment. Breakout to the upside could fuel a strong rally, while a breakdown could trigger heavy selling pressure.
#ZECUSDT #Zcash #CryptoAnalysis #Breakout #SymmetricalTriangle #Altcoins #TechnicalAnalysis #PriceAction
ZECUSDT 1WZEC ~ 1W Analysis
#ZEC Buy gradually from here if you still have a Conviction on this coin with a short -term target of at least 20%+.

ZECUSDT 1WZEC ~ 1W Analysis
#ZEC So far it still maintains its bullish structure. Buy from here if you still have a Conviction on this coin with a minimum target of 20%+.

ZECUSDT 1WZEC ~ 1W Analysis
#ZEC This is the lowest support for now. Buy gradually from here if you still have a Conviction on this Coin with a minimum target of 20%+

ZECUSDT: Is the Rebound Real, or Are We Heading Lower? Key LevelYello, Paradisers! Are we witnessing a genuine rebound for #ZECUSDT, or could this move be a trap before a deeper correction? Let’s take a closer look at what’s happening and the critical levels you should have on your radar.
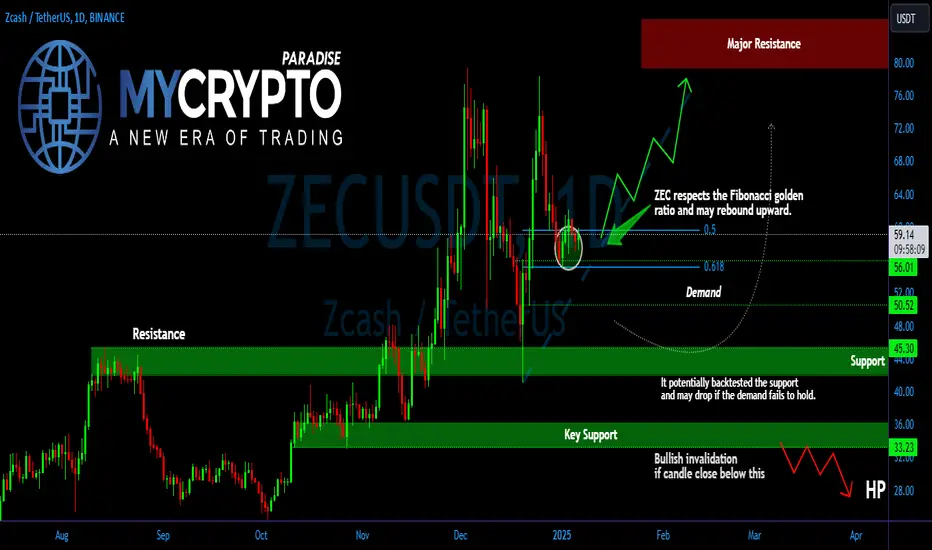
💎#ZEC has shown respect for the golden ratio of the Fibonacci retracement, suggesting a potential bounce to the upside. However, the key question is whether the price can sustain above the crucial demand zone between $56 and $50.20. If ZEC holds this level, the upward momentum could continue, with the next target being a retest of the strong resistance area.
💎But what happens if ZEC fails to hold above this demand zone? In that case, the price could drop back to the $45.30 support area, a level that has historically triggered significant rebounds. This zone has acted as a strong base in the past, and it’s likely that any dip toward this level could see buyers stepping in once again.
💎The risk increases if ZEC breaks below this support and closes below $33.20. If this happens, we could see a much deeper correction, potentially pushing the price even lower. A candle close below this level would invalidate the bullish outlook and indicate further downside ahead.
Stay disciplined, Paradisers. Consistency in trading comes from managing risk and staying patient.
MyCryptoParadise
iFeel the success🌴
ZECUSDT Broadening Wedge PatternZECUSDT technical analysis update
ZEC has been forming a broadening wedge pattern for the last 450 days. The price is now moving towards the wedge's resistance for a potential breakout, and it is trading above the 100 and 200 EMAs on the daily chart. If a breakout occurs, we can expect a strong bullish move.
Buy Level: $33.00
Stop loss: $25.00

Will ZECUSDT Break Out or Face a Reversal? Yello, Paradisers! Are you ready to navigate the turbulent waters of the #ZECUSDT market? Let's dive into the latest analysis!
💎#ZEC is currently forming a broadening wedge pattern, approaching a critical resistance area. A successful breakout above this resistance would validate the pattern, signaling a strong bullish momentum. This could lead to significant upward movement, potentially reaching our target resistance area.
💎However, if ZEC fails to break through and faces a hard rejection, we might see the price retesting the demand area around 28.6. This could be a pivotal moment for ZEC, as it would need to build new momentum here. If ZEC fails to rebound and breaks below this demand area, it could be a bad sign, potentially revisiting the Bullish Order Block (OB) area around 23.30.
💎For the bullish scenario to remain valid, ZEC must bounce back from the Bullish OB area and reclaim the 28.6 demand zone. The bullish outlook would be invalidated if ZEC breaks below the OB area with a daily candle close. In this case, the highest probability is a further downward movement and a potential dip.
Remember, patience and strategic planning are crucial in navigating these markets successfully.
MyCryptoParadise
iFeel the success🌴

ZEC/USDT Getting rejection, Keep an eye on the demand area!!💎 ZEC has recently encountered significant developments in the market. Currently, ZEC is facing a critical resistance area. If ZEC experiences a strong rejection of this resistance, it may retreat and retest the demand area.
💎 However, if ZEC successfully breaks above this resistance, it could signal bullish momentum and lead to a significant upward movement, possibly reaching our target at the bearish OB area.
💎 If ZEC retraces to retest the demand area after failing to break the key resistance, it's crucial for the price to bounce from this level and resume its upward trajectory in an attempt to break the resistance once again.
💎 However, if ZEC fails to bounce at the demand area and instead breaks down, it would indicate a bearish signal. This could lead to a continuation of the downward movement, with the price potentially decreasing further.

ZECUSDTZcash (Zec) has successfully broken out, marked by a confirmed ✅. The current price is undergoing a pullback, presenting a potential buying opportunity around $29.30. If the price rebounds from this level, the target could be set at $31.

ZECUSDT Elliott Waves AnalysisHello friends.
Please support my work by clicking the LIKE button👍(If you liked). Also i will appreciate for ur activity. Thank you!
Everything on the chart.
Entry: market and lower
Targets: 40 - 50 - 60
after first target reached move ur stop to breakeven
Stop: (depending of ur risk). ALWAYS follow ur RM .
risk is justified
Good luck everyone!
Follow me on TRADINGView, if you don't want to miss my next analysis or signals.
It's not financial advice.
Dont Forget, always make your own research before to trade my ideas!
Open to any questions and suggestions

🟢 ZECUSDT - 12H (09.10.2022)🟢 ZECUSDT
TF: 12H
Side: Long
SL: $49.96
TP 1: $59.13
TP 2: $63.63
TP 3: $67.28
A deeper analysis in to ZEC in the 12H time frame and why I think it will have a bullish rally in the coming weeks.

🟢 ZECUSDT - 3D (07.10.2022)🟢 ZECUSDT
TF: 3D
Side: Long
SL: $49.96
TP 1: $59.13
TP 2: $63.63
TP 3: $67.28
Buy ZECUSDT now and DCA over the next few weeks or buy when it enters the red area.
The 1W support should break it out of the falling wedge.

ZECUSDT Analysis (Local Vision)Hello friends.
Please support my work by clicking the LIKE button👍(If you liked). Also i will appreciate for ur activity. Thank you!
Everything on the chart.
Entry: market and lower
Target: 75 and ~80
after first target reached move ur stop to breakeven
Stop: ~51 (depending of ur risk). ALWAYS follow ur RM .
Risk/Reward: 1 to 4
risk is justified
Good luck everyone!
Follow me on TRADINGView, if you don't want to miss my next analysis or signals.
It's not financial advice.
Dont Forget, always make your own research before to trade my ideas!
Open to any questions and suggestions.

ZECUSDT Analysis (Local Vision)Hello friends.
Please support my work by clicking the LIKE button👍(If you liked). Also i will appreciate for ur activity. Thank you!
Everything on the chart.
Entry: market and lower
Target: 80 and ~90
after first target reached move ur stop to breakeven
Stop: ~55 (depending of ur risk). ALWAYS follow ur RM .
Risk/Reward: 1 to 3.5
risk is justified
Good luck everyone!
Follow me on TRADINGView, if you don't want to miss my next analysis or signals.
It's not financial advice.
Dont Forget, always make your own research before to trade my ideas!
Open to any questions and suggestions.

ZECUSDT AnalysisHello friends.
Please support my work by clicking the LIKE button(If you liked).Thank you!
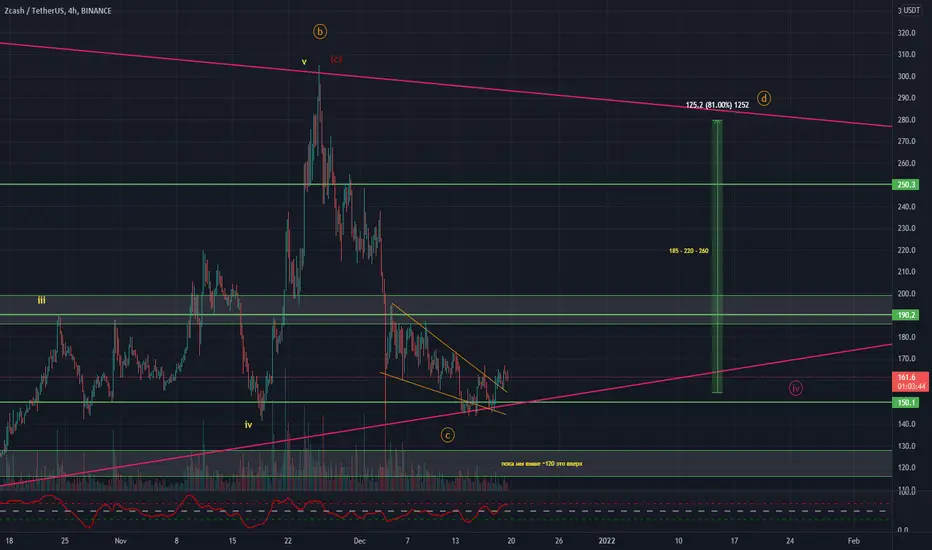
Everything on the chart.
open pos: market and lower
target: 185 - 220 - 260
after first target reached move ur stop to breakeven
stop: im w/o stop (depending of ur risk). ALWAYS follow ur RM .
risk is justified
Good luck everyone!
Follow me on TRADINGView, if you don't want to miss my next analysis or signals.
It's not financial advice.
Dont Forget, always make your own research before to trade my ideas!
zecusdt
👑 @F̲X̲o̲n̲e̲4̲a̲l̲l̲ 👑 VIP 🚀🚀
🟢 #ZEC- USDT 🔚BINANCE
💰 Buy now: 171.7
🔸TARGET 🎯
🔹 224.5
🔹260.5
🔹297.7
📝 RATIO: 10% Risk

ZECUSDT AnalysisHello friends.
Please support my work by clicking the LIKE button(If you liked).Thank you!
Everything on the chart.
open pos: market and lower
target: 169 - 179 - 210
after first target reached move ur stop to breakeven
stop: ~126(depending of ur risk). ALWAYS follow ur RM .
risk/reward 1 to 3
Good luck everyone!
Follow me on TRADINGView, if you don't want to miss my next analysis or signals.
It's not financial advice.
Dont Forget, always make your own research before to trade my ideas!
Will be very APPRECIATE FOR UR DONAT/coins :)
Open to your questions or suggestions(Looking for investors!).

ZECUSDT AnalysisHello friends.
Please support my work by clicking the LIKE button(If you liked).Thank you!
Everything on the chart.
open pos: market
target: 132 - 142 - 148
after first target reached move ur stop to breakeven
stop: ~106(depending of ur risk). ALWAYS follow ur RM .
risk/reward 1 to 1.5
Good luck everyone!
Follow me on TRADINGView, if you don't want to miss my next analysis or signals.
It's not financial advice.
Dont Forget, always make your own research before to trade my ideas!
Will be very appreciate for ur donat/coins :)
Open to your questions or suggestions(Looking for investors!).

ZECUSDT 4H: Possible LONGZECUSDT 4H: Possible LONG
As a result of the breakdown of level 130, a further rise to the next level of 175 is possible
