#ZEN/USDT Long plan#ZEN
The price is moving in a descending channel on the 1-hour timeframe. It has reached the lower boundary and is heading towards breaking above it, with a retest of the upper boundary expected.
We have a downtrend on the RSI indicator, which has reached near the lower boundary, and an upward rebound is expected.
There is a key support zone in green at 9.04. The price has bounced from this zone multiple times and is expected to bounce again.
We have a trend towards stability above the 100-period moving average, as we are moving close to it, which supports the upward movement.
Entry price: 9.21
First target: 9.37
Second target: 9.62
Third target: 9.95
Stop loss: Below the support zone in green.
Don't forget a simple thing: capital management.
For inquiries, please leave a comment.
Thank you.
ZEN

ZENUSDT UPDATE#ZEN
UPDATE
DGB Technical Setup
Pattern: Falling Wedge Pattern
Current Price: 9.05$
Target Price: 16.60$
Target % Gain: 80.74%
Technical Analysis: GIGGLE is breaking out of a falling wedge pattern on the 1D chart, indicating bullish potential. The price has recently surged above the resistance trendline, supported by an increase in volume. The setup is validated as the price approaches the key resistance areas.
Time Frame: 1D
Risk Management Tip: Always use proper risk management.

#ZEN/USDT Long plan#ZEN
The price is moving in a descending channel on the 1-hour timeframe. It has reached the lower boundary and is heading towards breaking above it, with a retest of the upper boundary expected.
We have a downtrend on the RSI indicator, which has reached near the lower boundary, and an upward rebound is expected.
There is a key support zone in green at the 296 price level. The price has bounced from this zone multiple times and is expected to bounce again.
We have a trend towards stability above the 100-period moving average, as we are moving close to it, which supports the upward movement.
Entry price: 9.27
First target: 9.52
Second target: 9.90
Third target: 10.36
Don't forget a simple principle: money management.
Place your stop-loss below the support zone in green.
For any questions, please leave a comment.
Thank you.

ZENUSDT.P – Be in ZEN With This Move DownAlright traders, let’s enter our inner calm,
because ZEN might be preparing a not-so-calm move down. 😅
Big picture?
I still think the whole crypto market wants to go much higher in the coming days or weeks.
The structure is improving, sentiment is shifting, everything looks ready for a broader pump…
BUT.
BTC had a pretty spicy pump yesterday,
and as we all know:
after every pump comes… confused sideways chop or a mini dip.
(Yin and Yang, baby.)
So I’m expecting a little relief pullback today or tomorrow —
and that’s exactly the kind of move we can leverage in ZENUSDT.P.
A small push lower, liquidity grab, maybe a wick that ruins someone’s morning —
and that’s our opportunity.
Nothing is guaranteed (because crypto is allergic to certainty),
so be careful, stay calm, breathe deeply,
and let ZEN guide you…
probably… 😂
⸻
⚠️ Risk management ON
No FOMO
No YOLO
Just peaceful, controlled trading like a true Zen master.
Good luck traders — stay ZEN, even when the chart isn’t. 🧘♂️📉📈✨

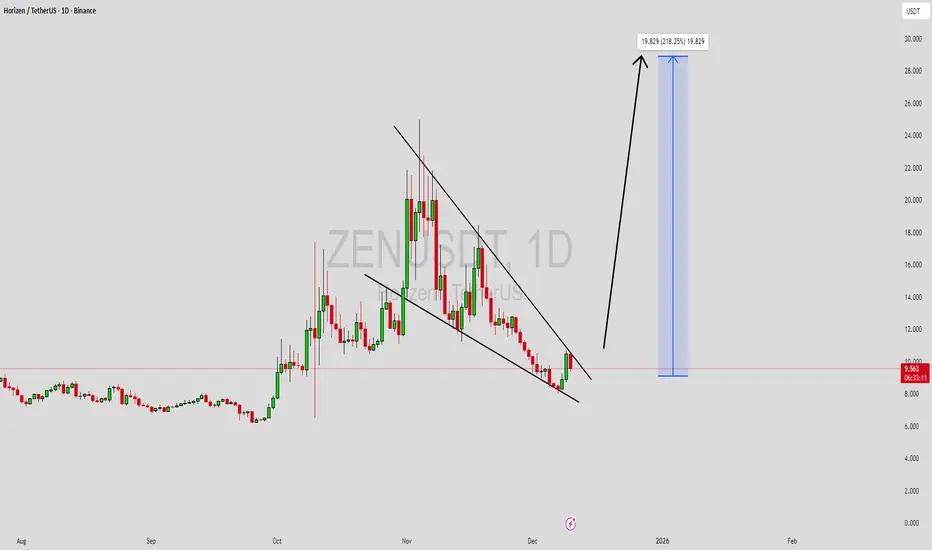
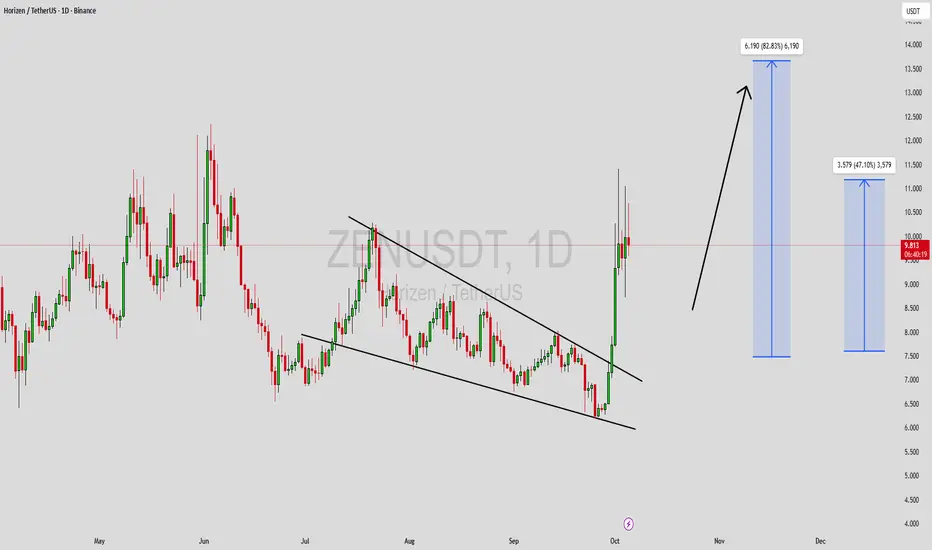
ZENUSDT Forming Falling WedgeZENUSDT is forming a clear falling wedge pattern, a classic bullish reversal signal that often indicates an upcoming breakout. The price has been consolidating within a narrowing range, suggesting that selling pressure is weakening while buyers are beginning to regain control. With consistent volume confirming accumulation at lower levels, the setup hints at a potential bullish breakout soon. The projected move could lead to an impressive gain of around 190% to 200% once the price breaks above the wedge resistance.
This falling wedge pattern is typically seen at the end of downtrends or corrective phases, and it represents a potential shift in market sentiment from bearish to bullish. Traders closely watching ZENUSDT are noting the strengthening momentum as it nears a breakout zone. The good trading volume adds confidence to this pattern, showing that market participants are positioning early in anticipation of a reversal.
Investors’ growing interest in ZENUSDT reflects rising confidence in the project’s long-term fundamentals and current technical strength. If the breakout confirms with sustained volume, this could mark the start of a fresh bullish leg. Traders might find this a valuable setup for medium-term gains, especially as the wedge pattern completes and buying momentum accelerates.
✅ Show your support by hitting the like button and
✅ Leaving a comment below! (What is your opinion about this Coin?)
Your feedback and engagement keep me inspired to share more insightful market analysis with you!
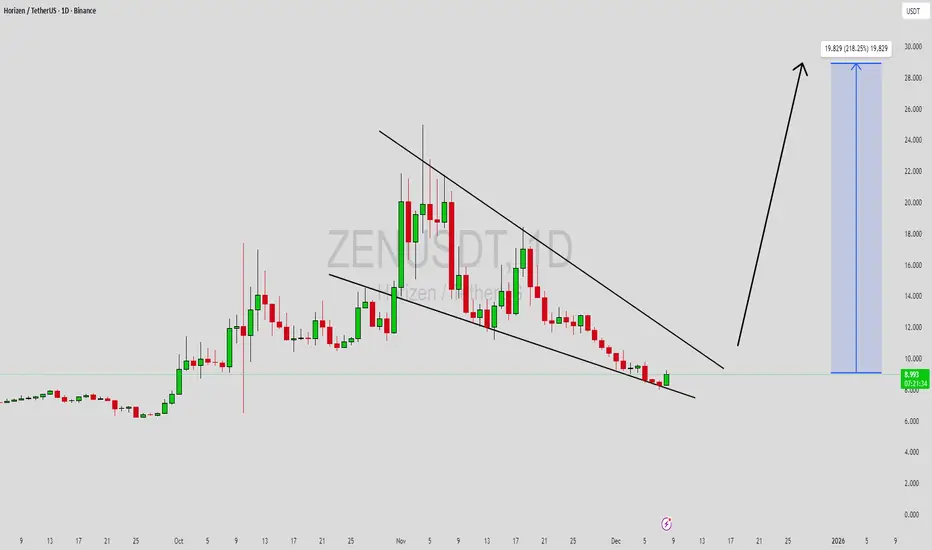
#ZECUSDT Privacy Narrative 2025-2026!ZEC is a privacy coin, and before we jump into numbers, you should ask yourself:
Why are privacy coins leading this cycle?
If you haven’t asked this yet, then it’s time to dive deeper —
because the narrative itself is part of the pump.
🔥 Main Question
Will ZEC hold momentum and continue bullish,
Or will $800 be the end of this wave?
Short Answer:
I see ZEC reaching $1,500 before or by Feb 2025.
We already caught it in the $4XX range days ago after making this TA:
🧭 Technical Foundation
This ZEC read is based on:
Elliott Wave (EW)
Gann Timing
Fibonacci Map
Harmonic structure confirmations
ZEC is currently at a crossroads, and the next monthly close will decide its fate.
🔑 What ZEC Needs for $1,500
1. Weekly Hold for now to keep things up:
$480 must hold weekly
No monthly close below this range
2. Bullish Monthly Close:
$560–$630 monthly close → excellent strength
Confirms buyers defending the trend
3. Breakout Key:
$800 → breakout
Opens runway to $1,200 → $1,500
New ATH window
Monthly close = the key factor for ZEC’s entire roadmap.
💼 Trade Plan (My Setup)
My Buy Levels:
$359.25
$419.13
$479.00 → now in profit
Stop-Loss:
$250
A monthly close below $ 230 invalidates the structure.
Risk Allocation:
3–5% max investment
Even with a 2× target, the risk remains controlled
→ You risk $1 to aim for $2+
Duration:
180+ days
Confidence Level: Medium
📌 Quick Recap
Key support: $480 weekly
Monthly range to watch: $560–$630
Breakout: $800 → $1,200 → $1,500
❌ Invalidation: Monthly below $260
🧩 Risk: 3–5%
⏱ Duration: 6 months+
⚓ Renzo Tip
“Privacy coins rise when the crowd starts whispering, smart captains listen before the storm arrives.”
Do your own research, as always.
Prayer
May Allah protect our trades from hidden risks, guide us toward clarity,
and give us wisdom to manage both fear and greed in every cycle.

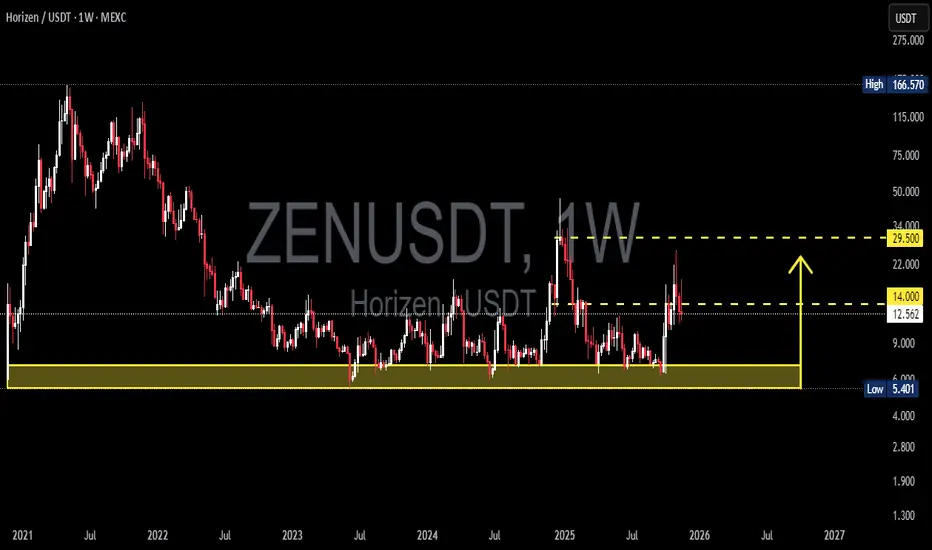
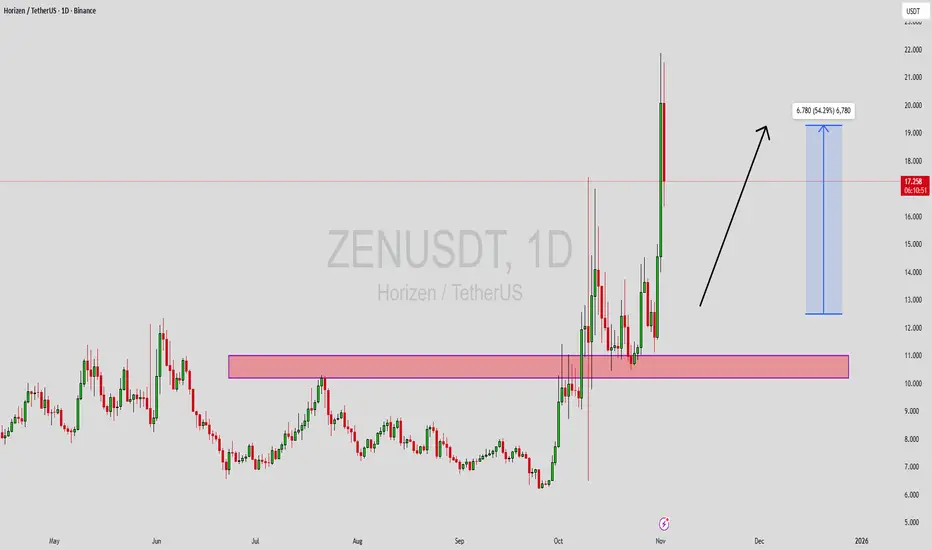
ZENUSDT: Multi-Year Base at 7–5.4 — Is the Major Breakout Near?ZENUSDT is now sitting at the most critical point in its multi-year structure.
Since 2022, every major move—every drop, every rebound—has returned to the same zone:
the accumulation base at 7 – 5.4, highlighted in yellow.
This isn’t just support.
This is the foundation of the entire long-term market cycle, a level that continues to hold despite multiple tests and high volatility.
Buyers have consistently defended this zone, suggesting strong long-term interest from deep-pocket participants.
Now, the structure is shifting:
Price has rebounded again and is pressing toward the key resistance at 14.0 — the level that decides whether ZEN stays trapped in its multi-year range… or begins a full trend reversal cycle.
A weekly breakout above 14.0 could unlock the path toward the next major liquidity zone at 29.5, created by the explosive vertical spike in 2025.
This chart is at a turning point.
---
📌 Major Pattern Highlights
1. Multi-Year Accumulation Base (7 – 5.4)
The strongest support on the chart; every deep wick has been absorbed here.
2. Volatility Spike & Imbalance (2025)
The breakout created a liquidity vacuum toward 29.5 — price is now attempting to re-approach that zone.
3. Compression Into Resistance (14.0)
A series of small higher-lows building pressure beneath the resistance.
This kind of coil structure often leads to an explosive breakout.
4. High-Timeframe Pendulum Range Reversal
The failure to make new lows often signals energy building for an upside expansion.
---
🟩 Bullish Scenario
Bullish confirmation = weekly close above 14.0.
If this happens:
Primary target: 29.5
(major supply zone + liquidity pool from the 2025 spike)
This zone has very little structural resistance → allowing for fast upward movement.
Potential shift into a mid-term bullish trend.
Important:
The breakout must show a strong candle body, not a wick-only touch.
---
🟥 Bearish Scenario
Bearish conditions only become valid if: Price closes weekly back below 7.0 — especially below 5.4.
If that occurs:
The long-term bullish structure collapses.
Market opens the door to new lows.
Sellers regain full control, marking the end of the accumulation story.
In simple terms:
5.4 is ZEN’s long-term survival level.
---
This chart represents a clash between multi-year accumulation and the leftover supply from the 2025 liquidity spike.
And right now, price sits exactly at the decision zone:
Will ZEN finally escape its 3-year sideways prison…
or get dragged back into the bottom range once again?
The next few weekly candles will shape the entire trend for Q1–Q2 2026.
#ZENUSDT #Horizen #CryptoTA #TechnicalAnalysis #WeeklyChart
#AccumulationZone #BreakoutSetup #MarketStructure
#LiquidityLevels #CryptoOutlook
$ZEN Long planAfter my previous LSE:ZEN post where I shared that $16.40 flip is key for ZEN if it wants to go higher. Which failed on 4h tmf to stay above the price. Now again its interesting for me. In a hour if we get the daily close above the purple line $16.40 area, where we get a retest I will go long.

Horizen ZEN price analysis#Horizen ( #ZEN ) is showing signs of renewed interest:
after previous delistings, the project is now being relisted on several exchanges. This usually indicates that liquidity providers or early stakeholders are reactivating their involvement.
Key fundamentals:
Current market cap: ~$250M
Structurally important support: $12
Technical target zone: $35–41
If price holds above the $12 level, the probability of a trend expansion toward the $35–41 range remains high.
Even at those levels, ZEN’s total valuation would be around $600M, which is still moderate compared to current market conditions.
P.S:
Additionally, our earlier #Starknet (#STRK) analysis appears to be unfolding as projected.
______________
◆ Follow us ❤️ for daily crypto insights & updates!
🚀 Don’t miss out on important market moves
🧠 DYOR | This is not financial advice, just thinking out loud

ZEN is Bullish (4H)The structure of ZEN is completely bullish, and we are looking for demand zones and supportive order blocks to enter long positions, since buy setups align with the bullish structure and therefore carry lower risk.
There is a key zone on the chart; as long as ZEN remains above this level, the market stays bullish. Only if the specified zone gets broken and cleaned out can we say that there is confirmation for ZEN to turn bearish.
Do not enter the position without capital management and stop setting
Comment if you have any questions
thank you

You Are Not Too Late Still... Price Might Go Places!Technicala Overview
For a while now, we've watched ZEN struggle against a significant resistance level between $9 to $12. Price kept going back down everytime it reached this zone.
The recent price action confirms a technical flip in prespective:
Price gone through that resistance with strong volume. This move invalidated the sellers' control.
What was once a wall of selling pressure has now transformed into solid support.
As you can see on the chart, the price has pulled back and bounced off this new support zone multiple times, confirming the buyer's pressure and accumulation.
Trading Plan
Ladder your buying orders from the current level to a potential correction level at around $13.
Our TP targets are $24, $30, $42
Holding a daily close above the support zone is crucial for this setup. Closing below on the daily might put ZEN in another deep coma and will take a while for it to recover.
Good Luck!

ZEN/USDT It is in pivot lvl and in OBI waited several days, and today the level I wanted was hit.
I have set tp1 and a long take profit

ZEN (Horizen) Could Behave Well In The Weeks AheadIts funny how human psychology may repeat Beauty is that charts can visually show you patterns, no matter the timeframe. Its amazing how human psychology may repeat itself. Beauty here is that charts can visually show you human psychology in patterns, no matter the timeframe you're comparing them to.
It has many similar tokenomics as Zcash (ZEC)
DISCLAMER:
Non of this should be take as a financial advise. Be well.

ZEN Long
**Technical Structure:** Horizen has a strong uptrend since September 28, 2025, with clear higher highs and higher lows. The October 10 flash crash was an eccentric event (liquidation cascade) that doesn't break the long-term structure. The blue trendline support at ~$13.30 is solid and would require exceptional bearish volume to break.
**Sector Catalysts:** Privacy coins are in a major bull run led by Zcash, which surged +1000% in 2025 and flipped Monero by market cap. Horizen is historically correlated with ZEC and remains undervalued relative to the sector leader. Bitcoin is holding strong support at $101k with massive liquidation walls defending $100k.
**Market Maker Psychology:** Why would market makers break the chart now by hitting the stop-loss at $12.40, when they could pump the price to $20-31 and dump at much better prices? Breaking the $13.30 support would constitute "chart crime" that scares away retail traders and reduces liquidity for optimal distribution. The rational strategy is to accumulate, pump during the privacy narrative, then distribute at the top.
**Odds of Success**
- **TP $16-18:** 65-70% probability
- **TP $20-25:** 45-50% probability
- **TP $28-31:** 20-25% probability
- **Stop-loss (<$12.40):** 25-30% probability

ZENUSDT Forming Bullish WaveZENUSDT is currently showing a bullish wave pattern, signaling potential continuation of upward momentum after a period of consolidation. This pattern reflects strong market structure and growing optimism among traders, suggesting that buyers are regaining control. The price has been forming higher lows with solid support from volume, which adds confidence to the potential breakout scenario. With good liquidity and investor activity, ZENUSDT appears poised for a move toward higher resistance zones in the near term.
The bullish wave pattern often indicates renewed buying pressure and a possible acceleration in price once key breakout levels are cleared. In the case of ZENUSDT, technical indicators point toward strengthening market sentiment, supported by rising demand and consistent trading volume. A breakout confirmation could trigger a sharp upward push, aligning with the expected gain range of 40% to 50%, as momentum traders look to capitalize on this emerging setup.
Investor interest in ZENUSDT continues to build as market confidence returns across major altcoins. The combination of healthy volume, solid technical structure, and positive price action suggests that ZENUSDT could be entering a new phase of bullish momentum. Traders focusing on medium-term setups may find this pair particularly appealing given its strong technical foundation and the potential for sustained upside in the current market environment.
✅ Show your support by hitting the like button and
✅ Leaving a comment below! (What is You opinion about this Coin)
Your feedback and engagement keep me inspired to share more insightful market analysis with you!
Universal Trading Psychology: The Patience Paradox PlaybookUniversal Trading Psychology: The Patience Paradox Playbook
A general discipline lesson you can apply to any liquid market and any timeframe
Most trading pain is not caused by a bad system. It is caused by impatience. The edge appears when you plan inactivity, watch with intent, wait for confirmation, and only act when setup quality is high. Cash is a position.
1. Why patience beats impulse in every market
Impatience sneaks in as early entries, overtrading, revenge trading, and random scaling. These habits feel productive because you are clicking and chasing motion. In reality they transfer capital from your future self to the present urge. Patience does the opposite. It gives your method time to read structure, it allows volatility and volume to normalize, and it keeps your energy for the right moment. The effect is universal. It does not matter if you trade indices, commodities, crypto, stocks, or forex. It does not matter if you trade on the one minute, the fifteen minute, or the daily. The core link is simple. Better timing raises the probability of an idea and lowers drawdown. Fewer attempts with higher quality improve expectancy and improve return divided by drawdown. That is the language that every account understands.
2. The Patience Paradox in plain language
The paradox says you can win more by doing less. You plan windows where you watch the market without touching the buy or sell buttons. You promise to yourself that you will let a timer run and you will only act after a confirmation event. Inactive minutes feel like a cost at first. In practice they are an investment. They reduce noise, they teach you the current regime, and they keep you calm enough to apply your edge. The paradox holds across sessions. The first minutes after a session begins often have high noise and emotional bait. The middle of the session can go quiet and trick you into forcing trades. The last minutes can be erratic. A patient trader respects this rhythm and keeps a written plan of when to observe and when to allow action.
3. Observation windows that fit any market
Observation windows are simple. Pick a time block. Start a timer. During the block you do not place orders. You watch the tape, the order of bars, the response to levels, and the size of swings. You collect awareness. You write one or two sentences about regime and structure. Then the timer ends. Only then do you look for a trade.
Observation windows you can adopt today
Pre session scan for fifteen minutes. You prepare levels and watch the first hints of tempo. Inactive only.
Session open observation for fifteen minutes. You let the first box form. No orders until a bar closes beyond this box and the next bar respects that information.
Mid session read for thirty minutes. You classify regime as active or quiet using simple filters and you decide trend, range, or inactivity.
Pre secondary session observation for fifteen minutes. If your market has two major sessions, you repeat the open observation idea.
Post trade cooldown for ten to twenty minutes. You break the dopamine loop, you write a short review, and you reset your attention.
How to make it practical
Place a small physical timer on your desk. A phone timer also works. Print a one page card with your windows and durations. When the window starts, say out loud that you are in observation and you will sit on hands until the timer ends. This small ritual builds identity. It tells your brain that watching is part of trading and not a waste of time.
4. Confirmation that cuts false signals
Impatience usually shows up as early entry without confirmation. The most portable rule is also the simplest. Wait for the close. A signal bar that looks perfect in the middle of its life can close with a wick, a rejection, or a full flip. If you still want earlier entry mechanics, use delay one bar. You let a signal print. You enter on the next bar only if price remains valid. Both rules reduce false positives and reduce the total number of attempts. That is a feature, not a bug. The quality of attempts goes up. The mood in your head calms down. Your journal becomes cleaner to read and your expectancy calculation becomes more stable.
A universal confirmation checklist
The setup is valid by your written plan.
Close confirms beyond structure or a retest holds and closes in your direction.
Regime filters are supportive. You see participation that matches the idea.
Risk and position size are defined. The exit is clear before you click.
5. Regime filters that travel well
Regime is the background condition that decides if your strategy is likely to read the market correctly. You can estimate regime with two simple filters. One measures volatility. One measures participation. These two are available on any platform.
Volatility filter
Use average true range with a long enough length to be stable. A common choice is length fifty. Express ATR as a percent of price so you can compare across timeframes and symbols. Compare the current reading to a baseline such as the daily median over the last few weeks. Above the baseline means active regime. Below means quiet regime.
Participation filter
Use a session volume baseline. A simple moving average of session volume works. When current volume is below the baseline, you demand more patience or you switch to range tactics. When current volume is above the baseline, you keep confirmation strict and you avoid random scalps.
Session filter
Every market has time of day effects. The first minutes can be noisy. Lunchtime or the middle band can be flat. The last minutes can snap. You plan a response. Observe at the open. Reduce attempts in the lull. Keep the end of session simple.
6. Cooldown, loss streak lockout, and daily loss limit
Cooldown is the fastest lever you can pull to stop impulsive streaks. After any loss you start a ten to twenty minute cooldown. You leave the chart zoom alone. You write a short paragraph with what the market did and what you did. This break cuts the urge circuit and lets you reset. A lockout is a stronger version. Two losses in a row at full risk trigger a lockout until the next session. Three small losses also trigger a lockout. A win does not cancel a lockout if you broke plan discipline during the win. A daily loss limit protects the account from a bad day. Pick a fraction of your weekly drawdown budget. When you hit it, you stop for the day. These three guardrails build survivorship and keep your mind from spiraling.
7. Expectancy and return divided by drawdown
Expectancy is the average outcome per trade. Write it as average win multiplied by win probability minus average loss multiplied by loss probability. It is a small number in units of R. That is fine. The power of expectancy is repetition. The second metric to watch is return divided by drawdown. This tells you how efficiently you compound given the cost of the worst pullback. Patience improves both. Cutting early attempts raises win probability and often raises average win because you pick cleaner structure. Removing impulsive losses reduces drawdown. Together they stabilize equity and make your process less emotional.
A quick way to measure
Log ten to twenty trades under the patience protocol. Record average win in R, average loss in R, win rate, and worst drawdown in R. Compute expectancy and return divided by drawdown. Then compare to your prior logs where you did not respect observation or confirmation. The difference shows you why patience pays.
8. A portable pre market checklist
Checklists prevent decision fatigue. Use one page. Keep the language simple.
Trade plan
Plan is visible. Strategy is defined.
Entry, exit, and position size rules are clear and written.
Journal template is open.
Market regime
ATR as percent of price labeled active or quiet.
Session volume labeled below baseline or above baseline.
Prior session open, high, low, close marked.
Observation windows for the first minutes drawn on the chart.
Session timing
Pre session observation timer set.
Open observation window scheduled.
Lunchtime lull noted.
Post session review time booked.
Watchlist and setup quality
Three to five names maximum.
One sentence setup description for each name.
Score the idea from one to five on quality.
Act only on four or five.
Confirmation and patience
Delay one bar or close based confirmation selected.
Inside bar means wait. No exceptions.
If FOMO appears, start a five minute micro timer and breathe.
Say out loud that doing nothing is a valid decision.
Risk and position control
Risk per trade set as a fixed percent of equity.
Stop never widened after entry.
No adds unless the plan explicitly allows scaling.
Daily loss limit and lockout rules visible.
Exit plan
Exit condition defined before entry.
Partial exits use confirmation if the system supports it.
If a volatility spike hits, reduce risk or exit per plan.
Journal the reason for the exit.
9. A simple setup quality score
A score makes permission to trade objective. Use five factors. Each is zero to two.
Factors
Regime. Market aligned with the strategy using the filters.
Structure. Setup is clean with room to target.
Timing. Observation respected and confirmation present.
Risk. Position size correct and stop placed where logic breaks.
Mindset. Patient attention present and FOMO absent.
Eight or more means permission. Seven or less means wait. This one rule saves careers.
10. A day in the life under the Patience Paradox
You begin fifteen minutes before your active session with an observation. You mark levels and write a short line about tempo. No orders. When the session begins you let the first box print. A breakout looks tempting inside the window, but you stay inactive. The next bar fails to close beyond the box. You extend the delay. Later participation rises above the baseline and volatility reaches the active zone. Your strategy calls for a trend pullback entry. You wait for a bar to close back in the direction of trend. Then you take a single position with one percent risk. The trade reaches target. You record the result and start a short cooldown. Near the second session open you repeat the observation idea. A clean setup appears but your score is only six. You pass and write one sentence to honor the decision. You end the day with a review and update your metrics. Equity is stable. Attention is calm. The process feels repeatable.
11. Overtrading prevention that actually works
Limit attempts per session. Use micro breaks whenever fatigue appears. If the journal shows a loss streak, apply the lockout. If volatility is too low, accept inactivity. If noise is heavy near the open, extend the observation. If you break any rule, record the event and reduce size on the next attempt. Prevention is cheaper than recovery. You will never regret a trade you did not take. You will often regret the one you forced.
12. Mindfulness and urge surf for traders
Mindfulness is not about long meditation. It is about a one minute reset. Watch the breath for one minute. Name the urge silently. Start a two minute timer and surf the wave. When it passes, you return to the plan. This tiny protocol moves you from reaction to response. Over time it raises your discipline score and lowers your cost of error.
13. Frequently asked behavior questions
What if the first clean setup appears during the first minutes of the day
You still respect the observation. The first confirmation bar after the window often gives better probability and a calmer entry.
What if volume stays below average all day
Reduce attempts. Focus on one name or stay inactive. Quality beats quantity. You are paid for selectivity, not activity.
What if I miss a win after a long wait
Missing is normal. Write it in the journal and keep the schedule. The market never runs out of opportunities. Your attention does.
How do I measure improvement
Track three numbers. Expectancy. Return divided by drawdown. Discipline score. If the first two rise and the third stays above four, the process is working.
14. Install the Paradox in one week
Day one. Print the checklist and the windows. Place a timer on the desk. Commit to half the usual number of attempts.
Day two. Run all observation windows. Log only confirmed ideas.
Day three. Add the cooldown after any loss. Review your writing at the end of the day.
Day four. Apply the loss streak lockout if needed. Protect the account.
Day five. Score every idea with the five factor grid. Only trade eight or more.
Day six. Compute expectancy and return divided by drawdown from the week.
Day seven. Read your notes. Keep the parts that made you calm and effective. Remove what was noise.
15. Comparator versus a passive baseline
You want to see that patience improves efficiency. Pick a baseline that matches your market. If there is a natural session, use buy at session open and exit at session close. If there is no natural session, use an always in market baseline. Then run the Patience Paradox protocol next to it.
How to compare in three steps
Compute baseline results across your window. Record attempts, average result per session, and worst drawdown in R.
Compute Paradox results with observation windows, confirmation, and guardrails. Record attempts, expectancy, and worst drawdown in R.
Compute return divided by drawdown for both. When the protocol is respected, this ratio usually improves even if total trades drop. Your account and your sleep benefit from that.
16. A journal template you can use today
Before entry
Setup name and one sentence description.
Regime notes on volatility and participation.
Quality score and reason for each point.
Risk in R and exit plan.
After exit
Result in R and whether the logic held.
What you felt and how you responded.
What you would repeat and what you would remove.
One sentence lesson for the board.
17. Advanced patience drills for professionals
The inside bar extension
When a bar prints inside the prior range you extend the observation by one more bar. This drill stops you from guessing breakouts and creates a natural delay.
The half size probation
After a loss you allow the next confirmed idea at half size. You return to full size only after a clean win that followed plan. This keeps you from trying to win it back.
The one pass rule
You allow yourself one pass on a marginal idea each week. You write the reason and the outcome. This rule prevents a cascade of rationalizations.
18. Closing perspective
Patience is not passive. It is active observation guided by rules. A professional monitors regime, respects timers, demands confirmation, and protects the account with cooldowns and lockouts. The paradox is simple. Inactivity at the right time raises probability, keeps drawdown shallow, and makes expectancy stable. Traders who internalize this find that the market stops feeling like a battle and starts feeling like a process. You do less. You see more. You let the best ideas come to you.
Education and analytics only. Not investment advice.
Thank you all for reading this article.
If you have any type of requests, drop a comment below.

ZENUSDT Forming Falling WedgeZENUSDT is forming a Falling Wedge Pattern, a strong bullish reversal signal that often marks the end of a downtrend and the start of a new upward move. This technical structure shows decreasing volatility with lower highs and lower lows converging towards a breakout point. Such a pattern indicates that sellers are losing control while buyers are beginning to gain strength — a setup that can lead to a sharp rally once resistance is broken.
The trading volume remains healthy, confirming that market participants are actively positioning themselves for the next major move. ZEN’s price has been consolidating within the wedge boundaries, and as momentum builds, the chances of an upside breakout increase significantly. A successful breakout could result in a potential gain of 50% to 60%+, especially if accompanied by rising volume and strong market sentiment.
Investor interest in ZENUSDT has been growing steadily, supported by improving market structure and a favorable technical outlook. This combination of bullish momentum, strong accumulation, and positive trader sentiment suggests that ZEN could be preparing for an impressive short-to-medium-term rally. Traders should keep a close watch on resistance levels for confirmation of the next leg up.
✅ Show your support by hitting the like button and
✅ Leaving a comment below! (What is You opinion about this Coin)
Your feedback and engagement keep me inspired to share more insightful market analysis with you!

ZENUSDT Forming Falling WedgeZENUSDT is showing a well-defined falling wedge pattern on the daily chart, a bullish setup that often precedes a strong upward move. After a period of sustained decline, the price has started to consolidate within narrowing trendlines, suggesting that selling pressure is easing. The good trading volume confirms that buyers are gradually stepping in, preparing for a potential breakout. This technical structure indicates that ZENUSDT may soon enter a bullish reversal phase once it breaks above the wedge resistance with confirmation.
A successful breakout could open the door for gains of around 40% to 50%+, driven by increased momentum and investor confidence. Historically, falling wedge breakouts on coins like ZENUSDT tend to produce sharp recoveries as traders recognize the shift in market sentiment. With volume supporting the pattern and price structure tightening, this pair is approaching a critical point where a bullish breakout could set off a strong rally toward higher resistance zones.
Investor interest in ZENUSDT has been rising, as many view it as undervalued compared to its long-term potential. The overall setup points toward accumulation, where larger players could be positioning themselves before a breakout. If market conditions remain favorable, this could become one of the more promising mid-term trading opportunities in the altcoin sector.
✅ Show your support by hitting the like button and
✅ Leaving a comment below! (What is You opinion about this Coin)
Your feedback and engagement keep me inspired to share more insightful market analysis with you!
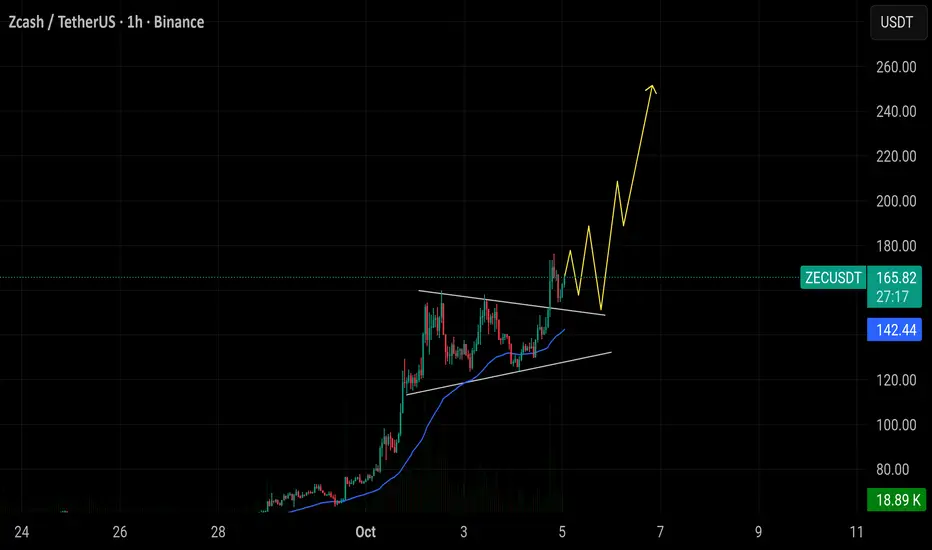
$ZEC/USDT has broken out of its wedge pattern and is currently $ZEC/USDT has broken out of its wedge pattern and is currently trading near 164. If price holds above 150, momentum could continue toward the 200–240 zone. The lower trendline support around 130 remains the key level to maintain the overall bullish structure.
$TRUTHUSDT has confirmed the falling wedge breakout with an 18% KUCOIN:TRUTHUSDT has confirmed the falling wedge breakout with an 18% pump, moving from 0.0147 to 0.0173+. As long as price holds above 0.0147 support, momentum stays bullish with the next upside targets at 0.0185 and 0.020. Losing 0.0147 would weaken this breakout move.

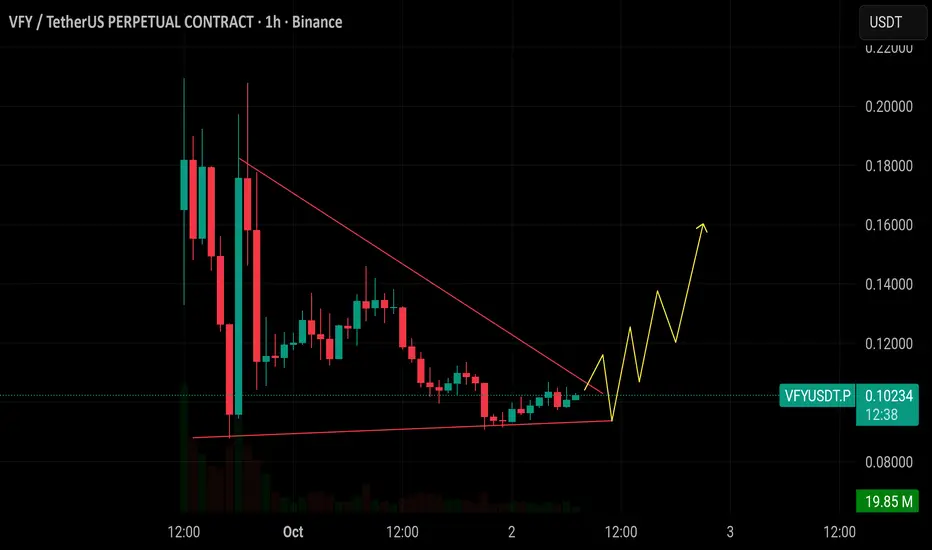
$VFY is forming a bullish wedge. Support is around 0.092. #btcASX:VFY is forming a bullish wedge. Support is around 0.092. A breakout above 0.11 could trigger a sharp move. Watch for rising volume spike may come soon. If confirmed, targets are 0.14 to 0.16. Chart looks ready for upside. ✅
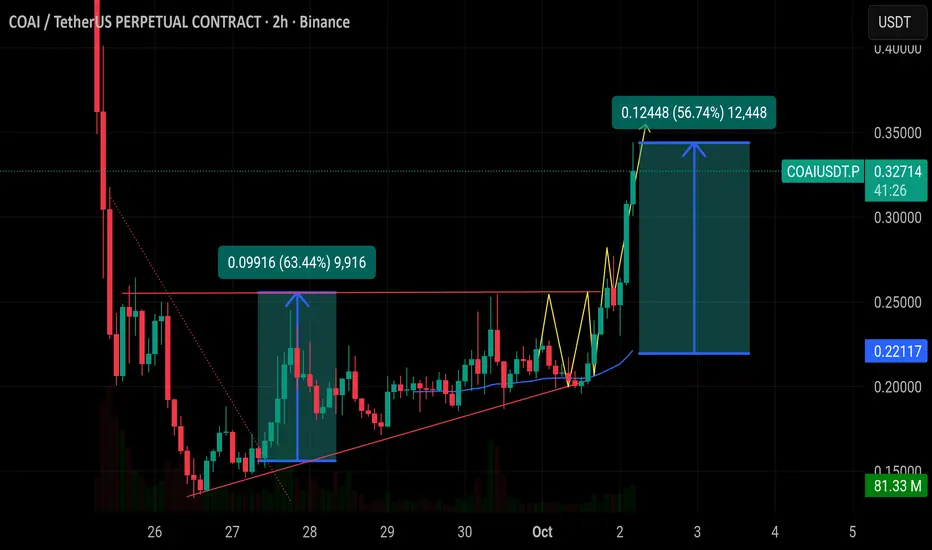
$COAI is pump 57% It broke out of a triangle pattern. $COAI is pump 57% It broke out of a triangle pattern. Now holding above the0.30 level. Support is around 0.25 for now. If this holds, next target is0.40. Trend is bullish with strong momentum. 🚀