#ZEN/USDT Long plan#ZEN
The price is moving in a descending channel on the 1-hour timeframe. It has reached the lower boundary and is heading towards breaking above it, with a retest of the upper boundary expected.
We have a downtrend on the RSI indicator, which has reached near the lower boundary, and an upward rebound is expected.
There is a key support zone in green at 9.04. The price has bounced from this zone multiple times and is expected to bounce again.
We have a trend towards stability above the 100-period moving average, as we are moving close to it, which supports the upward movement.
Entry price: 9.21
First target: 9.37
Second target: 9.62
Third target: 9.95
Stop loss: Below the support zone in green.
Don't forget a simple thing: capital management.
For inquiries, please leave a comment.
Thank you.
ZENBTC

ZENUSDT Forming Bullish MomentumZENUSDT is forming a clear bullish momentum pattern, a classic bullish reversal signal that often indicates an upcoming breakout. The price has been consolidating within a narrowing range, suggesting that selling pressure is weakening while buyers are beginning to regain control. With consistent volume confirming accumulation at lower levels, the setup hints at a potential bullish breakout soon. The projected move could lead to an impressive gain of around 90% to 100% once the price breaks above the wedge resistance.
This falling wedge pattern is typically seen at the end of downtrends or corrective phases, and it represents a potential shift in market sentiment from bearish to bullish. Traders closely watching ZENUSDT are noting the strengthening momentum as it nears a breakout zone. The good trading volume adds confidence to this pattern, showing that market participants are positioning early in anticipation of a reversal.
Investors’ growing interest in ZENUSDT reflects rising confidence in the project’s long-term fundamentals and current technical strength. If the breakout confirms with sustained volume, this could mark the start of a fresh bullish leg. Traders might find this a valuable setup for medium-term gains, especially as the wedge pattern completes and buying momentum accelerates.
✅ Show your support by hitting the like button and
✅ Leaving a comment below! (What is your opinion about this Coin?)
Your feedback and engagement keep me inspired to share more insightful market analysis with you!

ZENUSDT UPDATE#ZEN
UPDATE
DGB Technical Setup
Pattern: Falling Wedge Pattern
Current Price: 9.05$
Target Price: 16.60$
Target % Gain: 80.74%
Technical Analysis: GIGGLE is breaking out of a falling wedge pattern on the 1D chart, indicating bullish potential. The price has recently surged above the resistance trendline, supported by an increase in volume. The setup is validated as the price approaches the key resistance areas.
Time Frame: 1D
Risk Management Tip: Always use proper risk management.

ZENUSDT Forming Bullish MomentumZENUSDT is forming a clear bullish momentum pattern, a classic bullish reversal signal that often indicates an upcoming breakout. The price has been consolidating within a narrowing range, suggesting that selling pressure is weakening while buyers are beginning to regain control. With consistent volume confirming accumulation at lower levels, the setup hints at a potential bullish breakout soon. The projected move could lead to an impressive gain of around 90% to 100% once the price breaks above the wedge resistance.
This falling wedge pattern is typically seen at the end of downtrends or corrective phases, and it represents a potential shift in market sentiment from bearish to bullish. Traders closely watching ZENUSDT are noting the strengthening momentum as it nears a breakout zone. The good trading volume adds confidence to this pattern, showing that market participants are positioning early in anticipation of a reversal.
Investors’ growing interest in ZENUSDT reflects rising confidence in the project’s long-term fundamentals and current technical strength. If the breakout confirms with sustained volume, this could mark the start of a fresh bullish leg. Traders might find this a valuable setup for medium-term gains, especially as the wedge pattern completes and buying momentum accelerates.
✅ Show your support by hitting the like button and
✅ Leaving a comment below! (What is your opinion about this Coin?)
Your feedback and engagement keep me inspired to share more insightful market analysis with you!

#ZEN/USDT Long plan#ZEN
The price is moving in a descending channel on the 1-hour timeframe. It has reached the lower boundary and is heading towards breaking above it, with a retest of the upper boundary expected.
We have a downtrend on the RSI indicator, which has reached near the lower boundary, and an upward rebound is expected.
There is a key support zone in green at the 296 price level. The price has bounced from this zone multiple times and is expected to bounce again.
We have a trend towards stability above the 100-period moving average, as we are moving close to it, which supports the upward movement.
Entry price: 9.27
First target: 9.52
Second target: 9.90
Third target: 10.36
Don't forget a simple principle: money management.
Place your stop-loss below the support zone in green.
For any questions, please leave a comment.
Thank you.

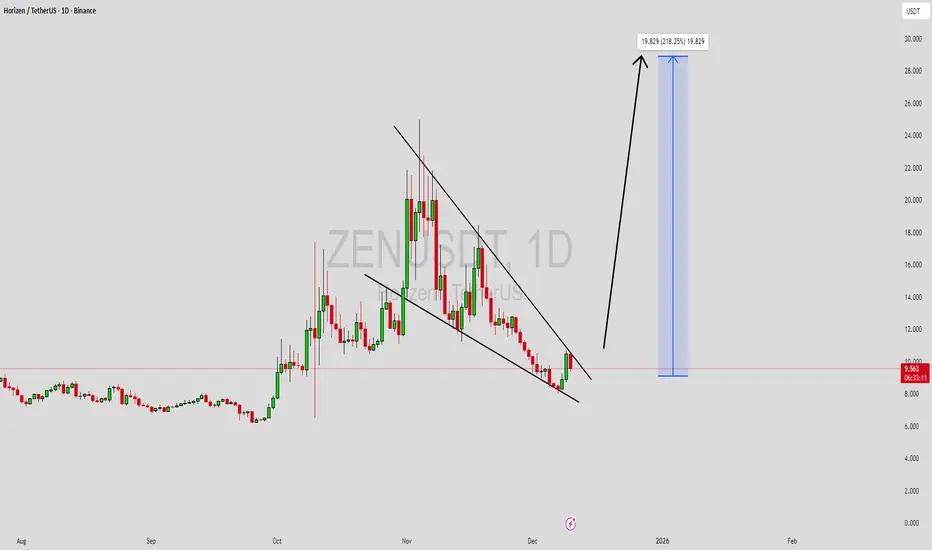
ZENUSDT Forming Falling WedgeZENUSDT is forming a clear falling wedge pattern, a classic bullish reversal signal that often indicates an upcoming breakout. The price has been consolidating within a narrowing range, suggesting that selling pressure is weakening while buyers are beginning to regain control. With consistent volume confirming accumulation at lower levels, the setup hints at a potential bullish breakout soon. The projected move could lead to an impressive gain of around 190% to 200% once the price breaks above the wedge resistance.
This falling wedge pattern is typically seen at the end of downtrends or corrective phases, and it represents a potential shift in market sentiment from bearish to bullish. Traders closely watching ZENUSDT are noting the strengthening momentum as it nears a breakout zone. The good trading volume adds confidence to this pattern, showing that market participants are positioning early in anticipation of a reversal.
Investors’ growing interest in ZENUSDT reflects rising confidence in the project’s long-term fundamentals and current technical strength. If the breakout confirms with sustained volume, this could mark the start of a fresh bullish leg. Traders might find this a valuable setup for medium-term gains, especially as the wedge pattern completes and buying momentum accelerates.
✅ Show your support by hitting the like button and
✅ Leaving a comment below! (What is your opinion about this Coin?)
Your feedback and engagement keep me inspired to share more insightful market analysis with you!
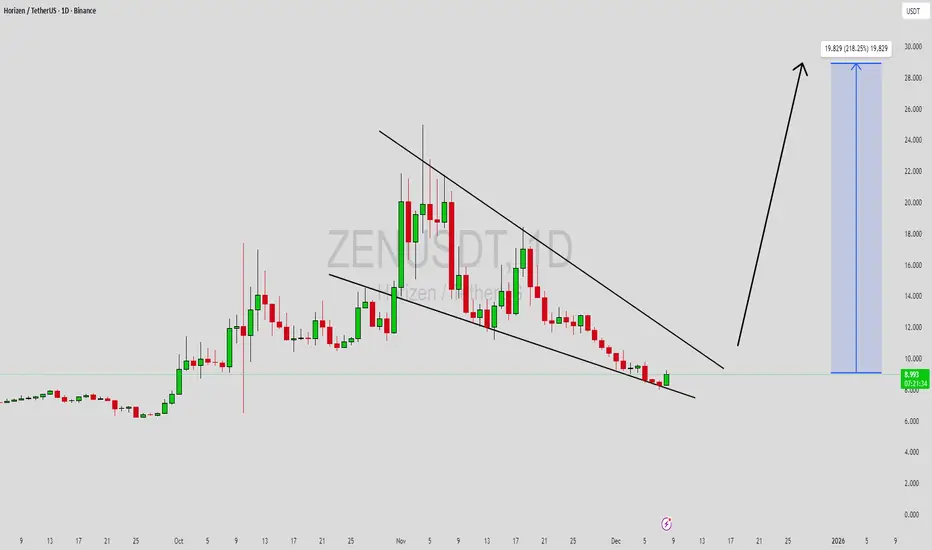
$ZEN Long planAfter my previous LSE:ZEN post where I shared that $16.40 flip is key for ZEN if it wants to go higher. Which failed on 4h tmf to stay above the price. Now again its interesting for me. In a hour if we get the daily close above the purple line $16.40 area, where we get a retest I will go long.

ZEN is Bullish (4H)The structure of ZEN is completely bullish, and we are looking for demand zones and supportive order blocks to enter long positions, since buy setups align with the bullish structure and therefore carry lower risk.
There is a key zone on the chart; as long as ZEN remains above this level, the market stays bullish. Only if the specified zone gets broken and cleaned out can we say that there is confirmation for ZEN to turn bearish.
Do not enter the position without capital management and stop setting
Comment if you have any questions
thank you

You Are Not Too Late Still... Price Might Go Places!Technicala Overview
For a while now, we've watched ZEN struggle against a significant resistance level between $9 to $12. Price kept going back down everytime it reached this zone.
The recent price action confirms a technical flip in prespective:
Price gone through that resistance with strong volume. This move invalidated the sellers' control.
What was once a wall of selling pressure has now transformed into solid support.
As you can see on the chart, the price has pulled back and bounced off this new support zone multiple times, confirming the buyer's pressure and accumulation.
Trading Plan
Ladder your buying orders from the current level to a potential correction level at around $13.
Our TP targets are $24, $30, $42
Holding a daily close above the support zone is crucial for this setup. Closing below on the daily might put ZEN in another deep coma and will take a while for it to recover.
Good Luck!

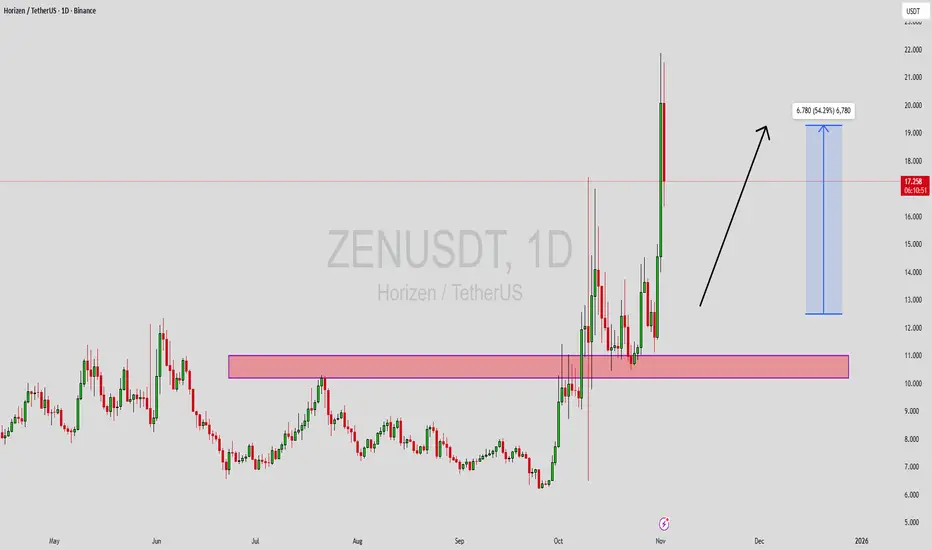
ZENUSDT Forming Bullish WaveZENUSDT is currently showing a bullish wave pattern, signaling potential continuation of upward momentum after a period of consolidation. This pattern reflects strong market structure and growing optimism among traders, suggesting that buyers are regaining control. The price has been forming higher lows with solid support from volume, which adds confidence to the potential breakout scenario. With good liquidity and investor activity, ZENUSDT appears poised for a move toward higher resistance zones in the near term.
The bullish wave pattern often indicates renewed buying pressure and a possible acceleration in price once key breakout levels are cleared. In the case of ZENUSDT, technical indicators point toward strengthening market sentiment, supported by rising demand and consistent trading volume. A breakout confirmation could trigger a sharp upward push, aligning with the expected gain range of 40% to 50%, as momentum traders look to capitalize on this emerging setup.
Investor interest in ZENUSDT continues to build as market confidence returns across major altcoins. The combination of healthy volume, solid technical structure, and positive price action suggests that ZENUSDT could be entering a new phase of bullish momentum. Traders focusing on medium-term setups may find this pair particularly appealing given its strong technical foundation and the potential for sustained upside in the current market environment.
✅ Show your support by hitting the like button and
✅ Leaving a comment below! (What is You opinion about this Coin)
Your feedback and engagement keep me inspired to share more insightful market analysis with you!
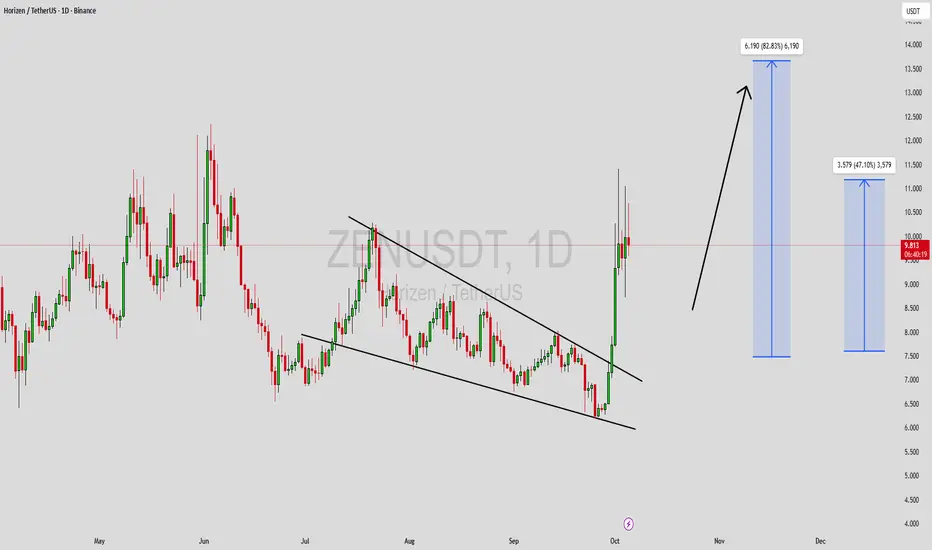
ZENUSDT Forming Falling WedgeZENUSDT is showing a well-defined falling wedge pattern on the daily chart, a bullish setup that often precedes a strong upward move. After a period of sustained decline, the price has started to consolidate within narrowing trendlines, suggesting that selling pressure is easing. The good trading volume confirms that buyers are gradually stepping in, preparing for a potential breakout. This technical structure indicates that ZENUSDT may soon enter a bullish reversal phase once it breaks above the wedge resistance with confirmation.
A successful breakout could open the door for gains of around 40% to 50%+, driven by increased momentum and investor confidence. Historically, falling wedge breakouts on coins like ZENUSDT tend to produce sharp recoveries as traders recognize the shift in market sentiment. With volume supporting the pattern and price structure tightening, this pair is approaching a critical point where a bullish breakout could set off a strong rally toward higher resistance zones.
Investor interest in ZENUSDT has been rising, as many view it as undervalued compared to its long-term potential. The overall setup points toward accumulation, where larger players could be positioning themselves before a breakout. If market conditions remain favorable, this could become one of the more promising mid-term trading opportunities in the altcoin sector.
✅ Show your support by hitting the like button and
✅ Leaving a comment below! (What is You opinion about this Coin)
Your feedback and engagement keep me inspired to share more insightful market analysis with you!
ZEN/USDT NEW increase view Zen/usdt has a pre increase view - should hold $7 for further increase
waiting to see if there are new confirmations on the way.

ZEN/USDT Daily Chart: Accumulation Before the Big Move? Hey traders! Let’s dive into this daily ZENUSDT chart. Horizon is in a sideways accumulation phase, forming an Expanding Wedge right after a massive bullish Falling Wedge breakout.
We’re also seeing a small inverted head and shoulders at the bottom support range of $7.08-$10.08 , with the neckline at $10.08 . ZEN recently revisited this level, and a confirmed breakout could propel it toward $18.08-$28.94 , with a major target at $41.15 .
If the breakout fails, we might see a pullback to the neckline at $10.08 or the shoulder support at $8.28 .
Key Levels to Watch:
Resistance: $18.08, $28.94, $41.15
Support: $8.28
Breakout Target: $41.15
Breakdown Risk: $8.28
Is ZEN about to skyrocket, or will this breakout fail? Let’s hear your thoughts below!

ZENUSDT Forming Bullish BreakoutZENUSDT is emerging as an attractive opportunity for traders looking to capitalize on mid-term altcoin breakouts. With good trading volume backing its recent price action, this pair has been gaining traction among market participants who expect a potential gain of 50% to 60%+. The current technical structure is showing early signs of a possible trend reversal, making this a crypto asset worth keeping on the watchlist for a swing trade setup.
Horizen (ZEN) continues to strengthen its position in the blockchain ecosystem with its focus on privacy and decentralized applications. Investors appreciate the project’s robust network and innovative sidechain solutions, which enhance scalability and interoperability. These fundamentals are fueling renewed interest, as more traders look for altcoins that combine real-world utility with promising price potential.
Technically, ZENUSDT appears to be forming a strong base that could lead to a healthy rally if the crypto market sentiment remains positive. Traders should monitor key support and resistance levels, along with volume spikes that could validate a breakout move. Given the steady accumulation phase, a decisive close above nearby resistance could open the door for significant upside.
✅ Show your support by hitting the like button and
✅ Leaving a comment below! (What is You opinion about this Coin)
Your feedback and engagement keep me inspired to share more insightful market analysis with you!

ZENUSDT Forming Bullish SwingZENUSDT is attracting a growing number of traders who are paying close attention to promising altcoins that could deliver solid gains in the coming weeks. Horizen (ZEN) continues to prove its resilience in the privacy and blockchain interoperability space, and the recent price action hints at a potential reversal from a strong support zone. With good volume building up and a stable base forming, many investors see this as a strategic accumulation level for the next bullish swing.
Horizen’s fundamental strength lies in its privacy features, sidechain solutions, and robust community backing. As blockchain adoption expands, projects with practical use cases like ZEN gain renewed interest, especially from long-term holders looking for coins with sustainable ecosystems. The expectation of a 50% to 60% gain aligns well with the current market structure, where we see buyers stepping in around the highlighted demand zone to push prices higher.
From a technical perspective, the recent chart shows that ZENUSDT is consolidating within a clear support area while maintaining good volume. This suggests that a breakout could be imminent if the price can close above nearby resistance levels. The next leg up could see ZEN retesting previous highs, providing attractive short-term opportunities for swing traders and position holders who are looking for coins with strong fundamentals and momentum potential.
✅ Show your support by hitting the like button and
✅ Leaving a comment below! (What is You opinion about this Coin)
Your feedback and engagement keep me inspired to share more insightful market analysis with you!

ZEN 200% upEnjoy the 200% gains i gave you on zen. Personally I have sold my bag. Because I'm a trader

ZENUSDT Breaks Resistance: Bullish Trend AheadZENUSDT Technical analysis update
ZENUSDT has broken the trend resistance line on the daily chart after 300 days of a ranging market. The current price is trading above the 100 and 200 EMAs on the daily chart, with a noticeable rise in volume over the past few days near the resistance line. If the breakout is confirmed on the daily chart, a strong bullish move can be expected.

$ZEN - The Zen WayBINANCE:ZENUSDT - Very Bullish W outlook. Looks super charged to run. For the moment its pretty bullish on the 4H chart. The entry point looks about right from here.

ZEN buy setup (1D)The large ZEN structure is not bearish given the higher Ls!
We have a liquidity pool at the bottom of the chart. With the sweep of this pool, we expect the price to pump by hitting the green range.
The target can be the red box.
Closing a daily candle below the invalidation level will violate this analysis.
For risk management, please don't forget stop loss and capital management
Comment if you have any questions
Thank You

ZEN has a bearish patternOn the chart, in large time frames, you can see a large QM on the chart, which can give us a good trading setup.
The right shoulder of QM is also completed. In this shoulder, you can look for close supply ranges.
We will look for sell/short positions in the specified supply range.
The targets are marked on the chart
Closing a daily candle above the invalidation level will violate the analysis
For risk management, please don't forget stop loss and capital management
When we reach the first target, save some profit and then change the stop to entry
Comment if you have any questions
Thank You

#ZEN/USDT#ZEN
The price is moving in a bearish channel on a 4-hour frame, which the price adheres to and is expected to break to the upside in an upward manner
It is expected that the Moving Average 100 test will be retested
We have a major support area in green at level 11
The RSI indicator has a downtrend that is expected to break higher
Entry price 12.62
The first target is 13.70
The second goal is 15.85
Third goal 17.75

ZEN LOOKS BULLISHWave B is over. It can now enter the bullish wave C.
By maintaining the green range, it can move towards the targets.
The targets are clear on the chart.
Closing a daily candle below the invalidation level will violate the analysis
For risk management, please don't forget stop loss and capital management
When we reach the first target, save some profit and then change the stop to entry
Comment if you have any questions
Thank You
