#ZEN/USDT Long plan#ZEN
The price is moving in a descending channel on the 1-hour timeframe. It has reached the lower boundary and is heading towards breaking above it, with a retest of the upper boundary expected.
We have a downtrend on the RSI indicator, which has reached near the lower boundary, and an upward rebound is expected.
There is a key support zone in green at the 296 price level. The price has bounced from this zone multiple times and is expected to bounce again.
We have a trend towards stability above the 100-period moving average, as we are moving close to it, which supports the upward movement.
Entry price: 9.27
First target: 9.52
Second target: 9.90
Third target: 10.36
Don't forget a simple principle: money management.
Place your stop-loss below the support zone in green.
For any questions, please leave a comment.
Thank you.
ZENUSD

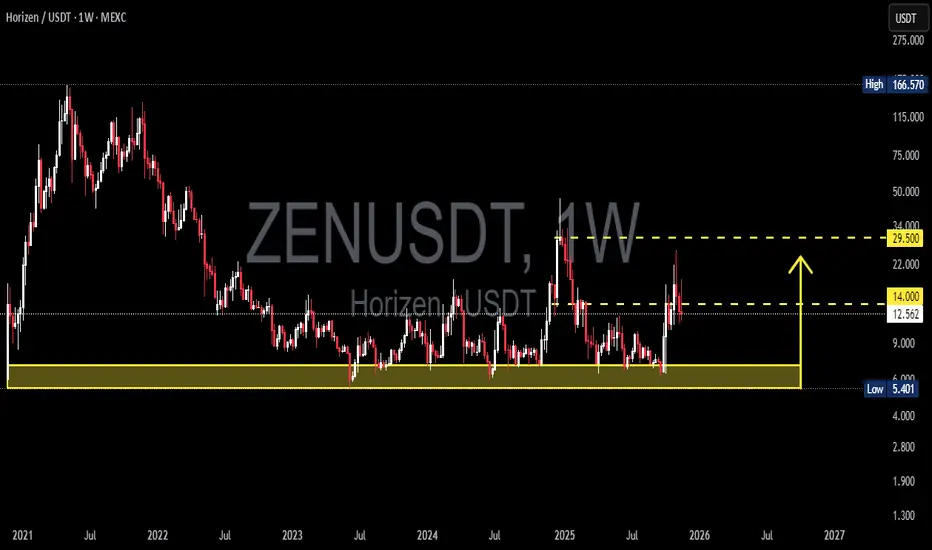
ZENUSDT: Multi-Year Base at 7–5.4 — Is the Major Breakout Near?ZENUSDT is now sitting at the most critical point in its multi-year structure.
Since 2022, every major move—every drop, every rebound—has returned to the same zone:
the accumulation base at 7 – 5.4, highlighted in yellow.
This isn’t just support.
This is the foundation of the entire long-term market cycle, a level that continues to hold despite multiple tests and high volatility.
Buyers have consistently defended this zone, suggesting strong long-term interest from deep-pocket participants.
Now, the structure is shifting:
Price has rebounded again and is pressing toward the key resistance at 14.0 — the level that decides whether ZEN stays trapped in its multi-year range… or begins a full trend reversal cycle.
A weekly breakout above 14.0 could unlock the path toward the next major liquidity zone at 29.5, created by the explosive vertical spike in 2025.
This chart is at a turning point.
---
📌 Major Pattern Highlights
1. Multi-Year Accumulation Base (7 – 5.4)
The strongest support on the chart; every deep wick has been absorbed here.
2. Volatility Spike & Imbalance (2025)
The breakout created a liquidity vacuum toward 29.5 — price is now attempting to re-approach that zone.
3. Compression Into Resistance (14.0)
A series of small higher-lows building pressure beneath the resistance.
This kind of coil structure often leads to an explosive breakout.
4. High-Timeframe Pendulum Range Reversal
The failure to make new lows often signals energy building for an upside expansion.
---
🟩 Bullish Scenario
Bullish confirmation = weekly close above 14.0.
If this happens:
Primary target: 29.5
(major supply zone + liquidity pool from the 2025 spike)
This zone has very little structural resistance → allowing for fast upward movement.
Potential shift into a mid-term bullish trend.
Important:
The breakout must show a strong candle body, not a wick-only touch.
---
🟥 Bearish Scenario
Bearish conditions only become valid if: Price closes weekly back below 7.0 — especially below 5.4.
If that occurs:
The long-term bullish structure collapses.
Market opens the door to new lows.
Sellers regain full control, marking the end of the accumulation story.
In simple terms:
5.4 is ZEN’s long-term survival level.
---
This chart represents a clash between multi-year accumulation and the leftover supply from the 2025 liquidity spike.
And right now, price sits exactly at the decision zone:
Will ZEN finally escape its 3-year sideways prison…
or get dragged back into the bottom range once again?
The next few weekly candles will shape the entire trend for Q1–Q2 2026.
#ZENUSDT #Horizen #CryptoTA #TechnicalAnalysis #WeeklyChart
#AccumulationZone #BreakoutSetup #MarketStructure
#LiquidityLevels #CryptoOutlook
$ZEN Long planAfter my previous LSE:ZEN post where I shared that $16.40 flip is key for ZEN if it wants to go higher. Which failed on 4h tmf to stay above the price. Now again its interesting for me. In a hour if we get the daily close above the purple line $16.40 area, where we get a retest I will go long.

Horizen ZEN price analysis#Horizen ( #ZEN ) is showing signs of renewed interest:
after previous delistings, the project is now being relisted on several exchanges. This usually indicates that liquidity providers or early stakeholders are reactivating their involvement.
Key fundamentals:
Current market cap: ~$250M
Structurally important support: $12
Technical target zone: $35–41
If price holds above the $12 level, the probability of a trend expansion toward the $35–41 range remains high.
Even at those levels, ZEN’s total valuation would be around $600M, which is still moderate compared to current market conditions.
P.S:
Additionally, our earlier #Starknet (#STRK) analysis appears to be unfolding as projected.
______________
◆ Follow us ❤️ for daily crypto insights & updates!
🚀 Don’t miss out on important market moves
🧠 DYOR | This is not financial advice, just thinking out loud

ZEN is Bullish (4H)The structure of ZEN is completely bullish, and we are looking for demand zones and supportive order blocks to enter long positions, since buy setups align with the bullish structure and therefore carry lower risk.
There is a key zone on the chart; as long as ZEN remains above this level, the market stays bullish. Only if the specified zone gets broken and cleaned out can we say that there is confirmation for ZEN to turn bearish.
Do not enter the position without capital management and stop setting
Comment if you have any questions
thank you

ZEN/USDT It is in pivot lvl and in OBI waited several days, and today the level I wanted was hit.
I have set tp1 and a long take profit

ZEN (Horizen) Could Behave Well In The Weeks AheadIts funny how human psychology may repeat Beauty is that charts can visually show you patterns, no matter the timeframe. Its amazing how human psychology may repeat itself. Beauty here is that charts can visually show you human psychology in patterns, no matter the timeframe you're comparing them to.
It has many similar tokenomics as Zcash (ZEC)
DISCLAMER:
Non of this should be take as a financial advise. Be well.

ZENUSDT | OB levels and CPR LVLit has quite a nice level.
Be careful with your risk because the altcoin market is crazy

ZENUSDT — Make or Break: Triple Bottom Formation or Breakdown?
🔎 Overview
Horizen (ZEN) against USDT on the weekly timeframe is now trading at a critical juncture. After a long decline from its all-time high near $169 in 2021, ZEN is retesting the historical support zone at $5.06–7.00. This area has acted as a strong demand zone for years, making it the ultimate “make or break level” for its next big move.
---
📊 Technical Analysis
Key Support Zone: $5.06 – $7.00 (tested multiple times since 2020).
Major Resistance Levels:
Minor: $8.63 → $10.55
Mid-range: $14.71 → $20.51
Strong: $30.08 → $49.78
Extreme Bullish Targets: $108 → $169 (ATH).
Market Structure: prolonged sideways accumulation after a strong downtrend, with a multi-bottom pattern forming at the support area. Long wicks to the downside suggest buying interest, but no confirmed reversal yet.
Weekly Sentiment: neutral-to-defensive, waiting for breakout confirmation.
---
🚀 Bullish Scenario
If the support holds, ZEN could be forming a triple bottom / long-term accumulation base:
1. First confirmation: weekly breakout above $8.63.
2. Bullish targets step by step:
Target 1: $10.55 (initial resistance).
Target 2: $14.71 (supply zone).
Target 3: $20.51 → $30.08 (potential mid-term reversal).
Long-term: a breakout above $50 could open the way toward $100+.
💡 Note: Accumulation often comes with rising volume. A breakout with strong volume would validate the bullish case.
---
⚠️ Bearish Scenario
If the $5.06–7.00 support fails:
1. A weekly close below $5.06 would confirm breakdown.
2. Next downside target: $3.80 (psychological and technical support).
3. This would likely extend the macro downtrend and push ZEN into a deeper undervaluation phase.
---
📌 Key Patterns & Insights
Multi-touch support: the more it gets tested, the weaker it may become without new buyers.
Potential triple bottom: strong bullish reversal signal if confirmed.
Risk/Reward setup: trading near support offers a clear invalidation point (below $5.0) with a potentially large upside.
---
🧭 Strategy & Risk Management
Conservative traders: wait for a confirmed weekly close above $8.63 before entering, targeting $10.55 → $14.71.
Aggressive traders: consider partial accumulation in the $5.5–6.7 range with a tight stop below $5.0.
Risk control: use stop-loss, scale targets, and adjust position sizing to market volatility.
---
📌 Conclusion
ZEN is standing at a golden zone:
If support holds: strong chance of a rebound toward $10–20+ and possibly higher.
If support breaks: risk of a drop toward $3.8.
This is the level that will decide whether ZEN is preparing for a major recovery or facing another capitulation leg.
---
#ZENUSDT #Horizen #Altcoins #CryptoAnalysis #SupportResistance #TripleBottom #SwingTrading #Cryptocurrency #PriceAction
ZENUSDT at the Crossroads: Accumulation or Final Breakdown?📊 Chart Overview
The ZEN/USDT (Horizen) pair on the 4D timeframe is currently sitting inside a critical accumulation zone between 5.40 – 9.24 USDT (highlighted in yellow). This area has acted as a demand zone for more than 2 years, with multiple successful retests.
The price is now trading around 7.887 USDT, right in the middle of the demand zone, which makes this a make-or-break level: either it holds for a strong bullish reversal or breaks down to new lows.
---
🔎 Pattern & Structure Analysis
1. Strong Demand Zone (5.40–9.24 USDT):
Tested multiple times since mid-2022.
Each dip into this zone has triggered significant buy reactions.
2. Sideways Consolidation (Range Trading):
Price has been ranging for years, indicating long-term accumulation.
The massive spike in early 2025 looks like a liquidity grab before returning into the range.
3. Layered Resistances:
10.795 USDT → the first major resistance, key to trigger a bullish breakout.
15.487 – 21.294 USDT → mid-term supply zone.
30.335 – 48.739 USDT → long-term bullish targets if breakout extends.
4. Validation Support:
5.409 USDT → the final line of defense. A 4D close below this level would invalidate the bullish structure and trigger deeper downside.
---
🚀 Bullish Scenario
Key condition: higher low inside the demand zone + confirmed breakout above 10.795 USDT with volume.
If breakout holds, upside targets:
🎯 Target 1: 15.487 USDT
🎯 Target 2: 21.294 USDT
🎯 Target 3: 30.335 USDT
🎯 Major Target: 48.739 – 54.730 USDT
This would mark a major trend reversal from accumulation phase into expansion.
---
⚠️ Bearish Scenario
If price fails to hold and closes a 4D candle below 5.409 USDT:
The demand zone flips into resistance.
Potential continuation lower towards 4.0–5.0 USDT.
This would indicate further distribution instead of accumulation.
---
📌 Conclusion & Strategy
ZEN is at a critical crossroads.
Bullish case: breakout above 10.795 confirms a structural reversal → targets up to 30+ USDT.
Bearish case: breakdown below 5.409 opens the door to deeper lows.
The 5.40–9.24 zone remains the most rational place for accumulation with tight risk management.
For swing traders, this is one of the prime setups before the next major directional move.
---
#ZENUSDT #Horizen #CryptoAnalysis #TechnicalAnalysis #SwingTrading #SupportResistance #CryptoBreakout #AccumulationPhase #BullishVsBearish

ZEN/USDT Weekly Analysis: Major Accumulation Zone
🧠 Chart Analysis Overview (ZEN/USDT - 1W):
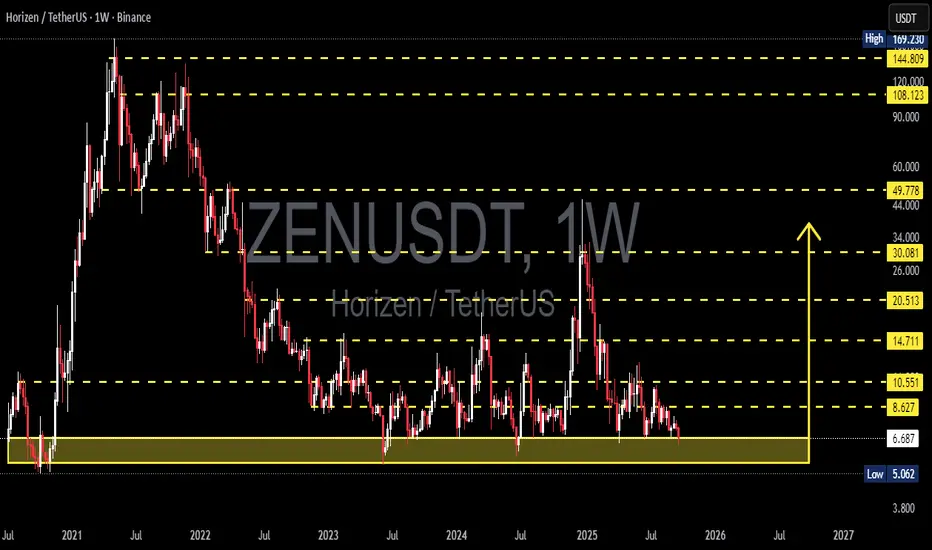
This weekly chart of Horizen (ZEN) against Tether (USDT) reveals a long-standing accumulation zone, and current price action hints at a possible bullish reversal from a critical support level. Let's break it down:
🟨 Key Technical Zone:
Support Zone (Accumulation): $5.06 – $7.06
This zone has acted as a major historical support area dating back to early 2021. Price has tested this zone multiple times and shown rejection, indicating strong buyer interest.
🔼 Bullish Scenario:
1. Price Rejection from Support:
A strong bullish wick and potential bounce from the $7.06 area signals accumulation and possible reversal.
2. Upside Targets (Resistance Levels):
$10.55
$14.71
$20.51
$30.08
$49.78
Long-Term Targets: $108.12, $144.81, $169.23
3. Pattern Indication:
The price action resembles a triple bottom formation within the accumulation zone — a classic reversal pattern. The yellow projection shows a possible V-shape recovery or rounded bottom scenario.
4. Trigger Confirmation:
A weekly close above $10.55 would be a confirmation trigger for continuation toward the next resistance levels.
🔽 Bearish Scenario:
1. Failure to Hold Support:
If ZEN fails to hold the $7.06 support zone and closes below the historical low of $5.06, the bullish structure invalidates.
2. Downside Risk:
Below $5.06, there's no significant historical support, suggesting a sharp drop is possible — potentially entering uncharted territory.
3. Bearish Breakdown Trigger:
Watch for weekly candle body close below $5.06 with volume — this could initiate further downside pressure.
📐 Pattern Summary:
Pattern Forming: Triple Bottom / Accumulation Zone
Type: Reversal Pattern
Timeframe Validity: Weekly – suitable for mid-long-term swing outlook
Volume Context: Not visible in chart, but confirmation from volume would strengthen the setup
🎯 Strategic Outlook:
Bias: Neutral-to-Bullish (While above $7.06)
Ideal Entry: Around $7.00 with tight invalidation below $5.00
Invalidation Level: Weekly close < $5.06
Take-Profit Zones: $10.55 → $14.71 → $20.51 → $30.08 → $49.78
#ZENUSDT #Horizen #CryptoReversal #AltcoinAnalysis #TripleBottom #TechnicalAnalysis #AccumulationZone #CryptoSwingTrade #SupportAndResistance #BullishSetup

ZENUSDT 1W Analysis ZEN ~ 1W Analysis
#ZEN Buy on retest of this support block with short term target of at least 20%+. This is the lowest support block for now.

ZENUSDT 1D AnalysisZEN ~ 1D Analysis
#ZEN Buy back gradually from here with a short term target of at least 15%+ from here.

ZENUSDT 1D AnalysisZEN ~ 1D Analysis
#ZEN Buy gradually from here if you still have a Conviction on this coin with a short -term target of at least 15%+ from here.

ZENUSDT 1WZEN ~ 1W Analysis
#ZEN Buy gradually from here if you still have a Conviction on this coin with a short -term target of at least 20%+.

ZENUSDT 1WZEN Update ~ 1W
#ZEN Retesting this support block,. If you still have Conviction on this coin,. buy back from here with a minimum target of 20%++

ZENUSDT 1WZEN Update ~ 1W
#ZEN So far it continues to maintain its bullish structure. This is wave 4 in the Eliot Wave pattern. Minimum target 20%++

ZEN showing a very impressive investment opportunityHi Everyone;
today we have one of the best risk to reward Investment opportunity
it is more than 1490 times the risk and the chart is look very promising.
I expect breaking the previous bear market key point will clear the way to the final target

ZEN 200% upEnjoy the 200% gains i gave you on zen. Personally I have sold my bag. Because I'm a trader

Horizen's Bullish Breakout: The Triangle AscendancyHorizen has shattered the descending triangle pattern and is now encountering resistance rejection on the weekly chart. Anticipate a surge past this resistance with amplified bullish momentum.
Horban Brothers.

$ZENUSDT - 4H Chart Trade OppurtunityBINANCE:ZENUSDT - As per my earlier ZEN call's from the past we made a huge rally from the earlier called out spot. This is another trade opportunity on the 4H chart where we could see some breakout soon and have some instant profit. Best Of Luck

#ZEN Ready to Make a Major Move From Key Support LevelYello, Paradisers! Is #Horizen (#ZEN) on the verge of a massive breakout or are we about to see a fake-out and a plunge? Let’s dive in:
💎#ZENUSDT is sitting at a crucial moment, testing the boundaries of a symmetrical triangle formation. After bouncing off the support zone of $6.94-$7.27, it’s showing signs of a breakout from this pattern. This breakout will increase the probability of a massive move toward internal resistance.
💎To confirm a move higher, #ZEN needs to clear $9.98—a critical internal resistance level. Breaking this could be the spark that ignites a rally towards the major resistance zone, potentially triggering a powerful upward push.
💎But if #ZEN starts losing momentum, watch out for a pullback to retest the support around $6.94-$7.27. A failure to hold this area would shift the outlook bearish, bringing the $6.05 demand zone into play.
💎A breakdown below $6.05 would signal the bulls are out of steam, and we could see further downside pressure. This invalidates the bullish setup, giving the bears complete control.
Be patient, play it safe, and always wait for confirmed breakouts or breakdowns before jumping in.
MyCryptoParadise
iFeel the success🌴

ZENUSDT Breaks Resistance: Bullish Trend AheadZENUSDT Technical analysis update
ZENUSDT has broken the trend resistance line on the daily chart after 300 days of a ranging market. The current price is trading above the 100 and 200 EMAs on the daily chart, with a noticeable rise in volume over the past few days near the resistance line. If the breakout is confirmed on the daily chart, a strong bullish move can be expected.
