Horizen BullishDemand Zone touch.
Confirmed price retracement rom november rally + trend shift.
Ready to move up.
Target are the highs.
25,45 and more.
Zenusdt

ZENUSDT: Bullish Push to 18.4? Over 100% Profit PotentialBINANCE:ZENUSDT is eyeing a massive bullish breakout on the daily chart , with price rebounding from key support after touching the downward trendline, converging with a potential entry zone that could launch explosive upside momentum if buyers overpower resistance amid recent consolidation. This setup hints at a game-changing reversal opportunity post-downtrend, targeting sky-high levels with insane risk-reward exceeding 1:4.5 and over 100% profit potential!🔥
Entry in the 7.5–8.3 range for a long position. Targets at 12.3 (first) , 18.4 (second) . Set a stop loss at a daily close below 6.2 , yielding a risk-reward ratio of more than 1:4.5 . Monitor for confirmation via a bullish candle close above entry with surging volume, leveraging ZEN's volatility for epic gains.🌟
📝 Trade Setup
🎯 Entry (Long):
7.5 – 8.3
(Scaling into this zone is valid with strict risk & capital management.)
🎯 Targets:
• 12.3 (first target)
• 18.4 (second target – macro expansion)
❌ Stop Loss:
• Daily close below 6.2
⚖️ Risk-to-Reward:
• > 1:4.5 Overall
💡 Your view?
Is ZENUSDT gearing up for a true trend reversal and 100%+ rally — or does it need more time to accumulate before the explosion? 👇
🌟If you have any question, don't hesitate to DM me:)

ZEN — Something Is Brewing
I’ve been tracking LSE:ZEN for a while, and it has finally caught my attention. No position yet — but the monthly chart looks great here.
In my view, this should finally trade above $15. There’s no real reason to fade that resistance after printing a clean monthly expansion bar off a well-defined demand zone.
Plan
Start adding some here
Continue adding once price trades above $15 to confirm the move
If this one decides to go, it has the structure for a clean 3–4x.
Still early, still patient — but this is definitely one to keep on the radar.
BINANCE:ZENUSDT

ZEN Main Trend (anonymous) 01/15/2025Logarithm. Time frame: 1 week. A very long horizontal channel with a large increment, with the price being pulled toward its resistance. A conditional fractal on a smaller scale is observed, with a previous local pump and a false exit from the channel range. The overall trend reversal and transition to phase 3 of the trend pump bowl occurs only after a breakout and consolidation above the descending line of the main trend (indicated by the thick red line).
Research online to find out what, how, who the investors are, and at what price this "investing" is. When trading, manage your risks, as the channel is very long and there are many passengers. Medium-term interest rates and logic are shown.
Locally now Time frame: 1 day.

#ZEN/USDT Long plan#ZEN
The price is moving in a descending channel on the 1-hour timeframe. It has reached the lower boundary and is heading towards breaking above it, with a retest of the upper boundary expected.
We have a downtrend on the RSI indicator, which has reached near the lower boundary, and an upward rebound is expected.
There is a key support zone in green at 9.04. The price has bounced from this zone multiple times and is expected to bounce again.
We have a trend towards stability above the 100-period moving average, as we are moving close to it, which supports the upward movement.
Entry price: 9.21
First target: 9.37
Second target: 9.62
Third target: 9.95
Stop loss: Below the support zone in green.
Don't forget a simple thing: capital management.
For inquiries, please leave a comment.
Thank you.

ZENUSDT Forming Bullish MomentumZENUSDT is forming a clear bullish momentum pattern, a classic bullish reversal signal that often indicates an upcoming breakout. The price has been consolidating within a narrowing range, suggesting that selling pressure is weakening while buyers are beginning to regain control. With consistent volume confirming accumulation at lower levels, the setup hints at a potential bullish breakout soon. The projected move could lead to an impressive gain of around 90% to 100% once the price breaks above the wedge resistance.
This falling wedge pattern is typically seen at the end of downtrends or corrective phases, and it represents a potential shift in market sentiment from bearish to bullish. Traders closely watching ZENUSDT are noting the strengthening momentum as it nears a breakout zone. The good trading volume adds confidence to this pattern, showing that market participants are positioning early in anticipation of a reversal.
Investors’ growing interest in ZENUSDT reflects rising confidence in the project’s long-term fundamentals and current technical strength. If the breakout confirms with sustained volume, this could mark the start of a fresh bullish leg. Traders might find this a valuable setup for medium-term gains, especially as the wedge pattern completes and buying momentum accelerates.
✅ Show your support by hitting the like button and
✅ Leaving a comment below! (What is your opinion about this Coin?)
Your feedback and engagement keep me inspired to share more insightful market analysis with you!

ZENUSDT UPDATE#ZEN
UPDATE
DGB Technical Setup
Pattern: Falling Wedge Pattern
Current Price: 9.05$
Target Price: 16.60$
Target % Gain: 80.74%
Technical Analysis: GIGGLE is breaking out of a falling wedge pattern on the 1D chart, indicating bullish potential. The price has recently surged above the resistance trendline, supported by an increase in volume. The setup is validated as the price approaches the key resistance areas.
Time Frame: 1D
Risk Management Tip: Always use proper risk management.

ZENUSDT Forming Bullish MomentumZENUSDT is forming a clear bullish momentum pattern, a classic bullish reversal signal that often indicates an upcoming breakout. The price has been consolidating within a narrowing range, suggesting that selling pressure is weakening while buyers are beginning to regain control. With consistent volume confirming accumulation at lower levels, the setup hints at a potential bullish breakout soon. The projected move could lead to an impressive gain of around 90% to 100% once the price breaks above the wedge resistance.
This falling wedge pattern is typically seen at the end of downtrends or corrective phases, and it represents a potential shift in market sentiment from bearish to bullish. Traders closely watching ZENUSDT are noting the strengthening momentum as it nears a breakout zone. The good trading volume adds confidence to this pattern, showing that market participants are positioning early in anticipation of a reversal.
Investors’ growing interest in ZENUSDT reflects rising confidence in the project’s long-term fundamentals and current technical strength. If the breakout confirms with sustained volume, this could mark the start of a fresh bullish leg. Traders might find this a valuable setup for medium-term gains, especially as the wedge pattern completes and buying momentum accelerates.
✅ Show your support by hitting the like button and
✅ Leaving a comment below! (What is your opinion about this Coin?)
Your feedback and engagement keep me inspired to share more insightful market analysis with you!

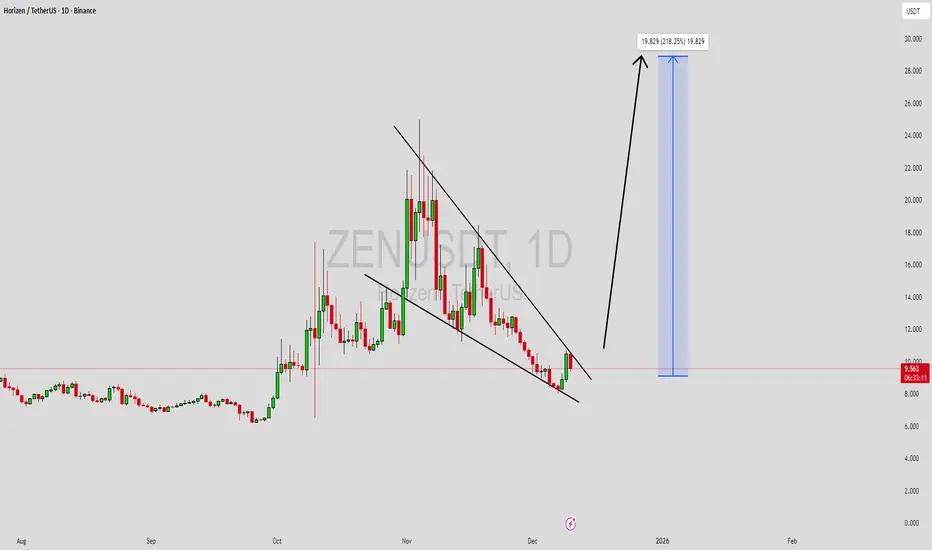
ZEN Daily Demand Reload for a New Leg UpThis BINANCE:ZENUSDT idea focuses on a potential bullish reversal from higher‑timeframe demand after an extended daily downtrend.
The road can be open to strong demand/OB zone at the bottom of the chart, where previous buying originated, and a short‑term break of structure is already marked, hinting at the start of a possible shift in momentum.
The dashed path projects a series of higher highs and higher lows targeting first the daily imbalance (D‑Imb) around the prior range, and then a larger continuation move toward the 17–19 USDT area, with the current demand zone used as invalidation for the setup. Timing around after 26 December 2025

#ZEN/USDT Long plan#ZEN
The price is moving in a descending channel on the 1-hour timeframe. It has reached the lower boundary and is heading towards breaking above it, with a retest of the upper boundary expected.
We have a downtrend on the RSI indicator, which has reached near the lower boundary, and an upward rebound is expected.
There is a key support zone in green at the 296 price level. The price has bounced from this zone multiple times and is expected to bounce again.
We have a trend towards stability above the 100-period moving average, as we are moving close to it, which supports the upward movement.
Entry price: 9.27
First target: 9.52
Second target: 9.90
Third target: 10.36
Don't forget a simple principle: money management.
Place your stop-loss below the support zone in green.
For any questions, please leave a comment.
Thank you.

ZENUSDT.P – Be in ZEN With This Move DownAlright traders, let’s enter our inner calm,
because ZEN might be preparing a not-so-calm move down. 😅
Big picture?
I still think the whole crypto market wants to go much higher in the coming days or weeks.
The structure is improving, sentiment is shifting, everything looks ready for a broader pump…
BUT.
BTC had a pretty spicy pump yesterday,
and as we all know:
after every pump comes… confused sideways chop or a mini dip.
(Yin and Yang, baby.)
So I’m expecting a little relief pullback today or tomorrow —
and that’s exactly the kind of move we can leverage in ZENUSDT.P.
A small push lower, liquidity grab, maybe a wick that ruins someone’s morning —
and that’s our opportunity.
Nothing is guaranteed (because crypto is allergic to certainty),
so be careful, stay calm, breathe deeply,
and let ZEN guide you…
probably… 😂
⸻
⚠️ Risk management ON
No FOMO
No YOLO
Just peaceful, controlled trading like a true Zen master.
Good luck traders — stay ZEN, even when the chart isn’t. 🧘♂️📉📈✨

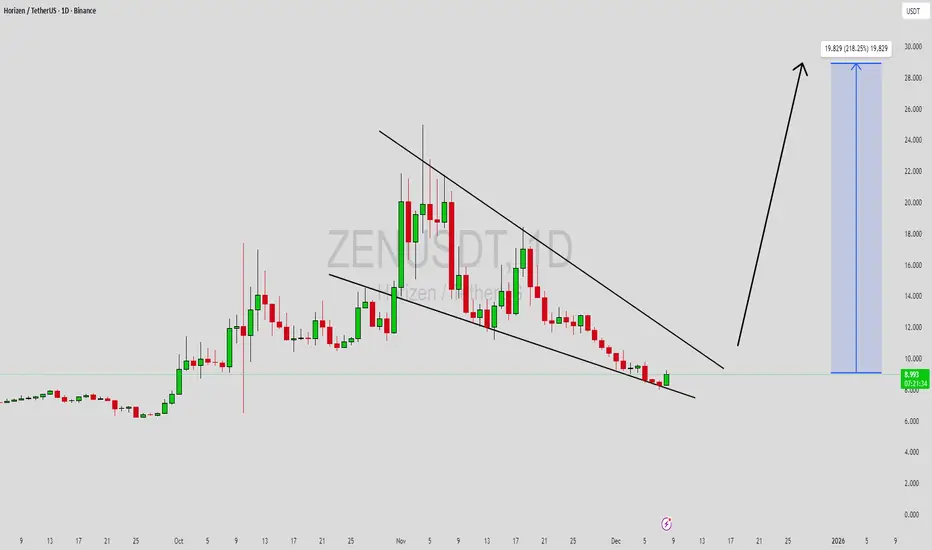
ZENUSDT Forming Falling WedgeZENUSDT is forming a clear falling wedge pattern, a classic bullish reversal signal that often indicates an upcoming breakout. The price has been consolidating within a narrowing range, suggesting that selling pressure is weakening while buyers are beginning to regain control. With consistent volume confirming accumulation at lower levels, the setup hints at a potential bullish breakout soon. The projected move could lead to an impressive gain of around 190% to 200% once the price breaks above the wedge resistance.
This falling wedge pattern is typically seen at the end of downtrends or corrective phases, and it represents a potential shift in market sentiment from bearish to bullish. Traders closely watching ZENUSDT are noting the strengthening momentum as it nears a breakout zone. The good trading volume adds confidence to this pattern, showing that market participants are positioning early in anticipation of a reversal.
Investors’ growing interest in ZENUSDT reflects rising confidence in the project’s long-term fundamentals and current technical strength. If the breakout confirms with sustained volume, this could mark the start of a fresh bullish leg. Traders might find this a valuable setup for medium-term gains, especially as the wedge pattern completes and buying momentum accelerates.
✅ Show your support by hitting the like button and
✅ Leaving a comment below! (What is your opinion about this Coin?)
Your feedback and engagement keep me inspired to share more insightful market analysis with you!
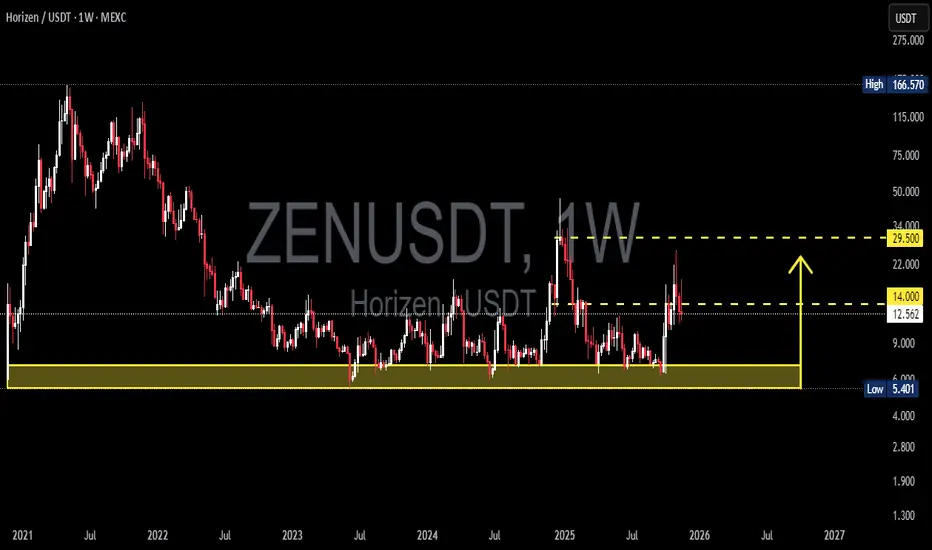
ZENUSDT: Multi-Year Base at 7–5.4 — Is the Major Breakout Near?ZENUSDT is now sitting at the most critical point in its multi-year structure.
Since 2022, every major move—every drop, every rebound—has returned to the same zone:
the accumulation base at 7 – 5.4, highlighted in yellow.
This isn’t just support.
This is the foundation of the entire long-term market cycle, a level that continues to hold despite multiple tests and high volatility.
Buyers have consistently defended this zone, suggesting strong long-term interest from deep-pocket participants.
Now, the structure is shifting:
Price has rebounded again and is pressing toward the key resistance at 14.0 — the level that decides whether ZEN stays trapped in its multi-year range… or begins a full trend reversal cycle.
A weekly breakout above 14.0 could unlock the path toward the next major liquidity zone at 29.5, created by the explosive vertical spike in 2025.
This chart is at a turning point.
---
📌 Major Pattern Highlights
1. Multi-Year Accumulation Base (7 – 5.4)
The strongest support on the chart; every deep wick has been absorbed here.
2. Volatility Spike & Imbalance (2025)
The breakout created a liquidity vacuum toward 29.5 — price is now attempting to re-approach that zone.
3. Compression Into Resistance (14.0)
A series of small higher-lows building pressure beneath the resistance.
This kind of coil structure often leads to an explosive breakout.
4. High-Timeframe Pendulum Range Reversal
The failure to make new lows often signals energy building for an upside expansion.
---
🟩 Bullish Scenario
Bullish confirmation = weekly close above 14.0.
If this happens:
Primary target: 29.5
(major supply zone + liquidity pool from the 2025 spike)
This zone has very little structural resistance → allowing for fast upward movement.
Potential shift into a mid-term bullish trend.
Important:
The breakout must show a strong candle body, not a wick-only touch.
---
🟥 Bearish Scenario
Bearish conditions only become valid if: Price closes weekly back below 7.0 — especially below 5.4.
If that occurs:
The long-term bullish structure collapses.
Market opens the door to new lows.
Sellers regain full control, marking the end of the accumulation story.
In simple terms:
5.4 is ZEN’s long-term survival level.
---
This chart represents a clash between multi-year accumulation and the leftover supply from the 2025 liquidity spike.
And right now, price sits exactly at the decision zone:
Will ZEN finally escape its 3-year sideways prison…
or get dragged back into the bottom range once again?
The next few weekly candles will shape the entire trend for Q1–Q2 2026.
#ZENUSDT #Horizen #CryptoTA #TechnicalAnalysis #WeeklyChart
#AccumulationZone #BreakoutSetup #MarketStructure
#LiquidityLevels #CryptoOutlook
$ZEN Long planAfter my previous LSE:ZEN post where I shared that $16.40 flip is key for ZEN if it wants to go higher. Which failed on 4h tmf to stay above the price. Now again its interesting for me. In a hour if we get the daily close above the purple line $16.40 area, where we get a retest I will go long.

Horizen ZEN price analysis#Horizen ( #ZEN ) is showing signs of renewed interest:
after previous delistings, the project is now being relisted on several exchanges. This usually indicates that liquidity providers or early stakeholders are reactivating their involvement.
Key fundamentals:
Current market cap: ~$250M
Structurally important support: $12
Technical target zone: $35–41
If price holds above the $12 level, the probability of a trend expansion toward the $35–41 range remains high.
Even at those levels, ZEN’s total valuation would be around $600M, which is still moderate compared to current market conditions.
P.S:
Additionally, our earlier #Starknet (#STRK) analysis appears to be unfolding as projected.
______________
◆ Follow us ❤️ for daily crypto insights & updates!
🚀 Don’t miss out on important market moves
🧠 DYOR | This is not financial advice, just thinking out loud

$ZEN Downtrend Intact – Testing Bottom 3 ResilienceBINANCE:ZENUSDT LSE:ZEN Downtrend Intact – Testing Bottom 3 Resilience 📉
Altcoin Pioneers! The weekly ZEN chart paints a textbook bearish picture: sequential lower tops (1-3) capping rallies under that blue descending channel, with price now probing Bottom 3 around 12.68 after Bottom 2 support at ~17k. Volume's waning on upsides, screaming distribution—Horizen's macro fatigue is real.
Hold support? Decent shot if we get a volume spike and RSI holds above 30 (currently neutral). Breakout above resistance? Forget it short-term; needs >20k close to flip the script. Deeper dip risk? High—channel projects to 8k if cracks, aligning with 200W MA.
Target: Rebound to 15k max on hold, or slide to 10k on break. Eyes on: Ichimoku cloud for dynamic support, funding rates for sentiment, and ecosystem news. Tread light! ⚠️🛡️
#Horizen #CryptoBear #TAWeekly

You Are Not Too Late Still... Price Might Go Places!Technicala Overview
For a while now, we've watched ZEN struggle against a significant resistance level between $9 to $12. Price kept going back down everytime it reached this zone.
The recent price action confirms a technical flip in prespective:
Price gone through that resistance with strong volume. This move invalidated the sellers' control.
What was once a wall of selling pressure has now transformed into solid support.
As you can see on the chart, the price has pulled back and bounced off this new support zone multiple times, confirming the buyer's pressure and accumulation.
Trading Plan
Ladder your buying orders from the current level to a potential correction level at around $13.
Our TP targets are $24, $30, $42
Holding a daily close above the support zone is crucial for this setup. Closing below on the daily might put ZEN in another deep coma and will take a while for it to recover.
Good Luck!

ZEN/USDT It is in pivot lvl and in OBI waited several days, and today the level I wanted was hit.
I have set tp1 and a long take profit

ZENUSDT | OB levels and CPR LVLit has quite a nice level.
Be careful with your risk because the altcoin market is crazy

ZEN Long
**Technical Structure:** Horizen has a strong uptrend since September 28, 2025, with clear higher highs and higher lows. The October 10 flash crash was an eccentric event (liquidation cascade) that doesn't break the long-term structure. The blue trendline support at ~$13.30 is solid and would require exceptional bearish volume to break.
**Sector Catalysts:** Privacy coins are in a major bull run led by Zcash, which surged +1000% in 2025 and flipped Monero by market cap. Horizen is historically correlated with ZEC and remains undervalued relative to the sector leader. Bitcoin is holding strong support at $101k with massive liquidation walls defending $100k.
**Market Maker Psychology:** Why would market makers break the chart now by hitting the stop-loss at $12.40, when they could pump the price to $20-31 and dump at much better prices? Breaking the $13.30 support would constitute "chart crime" that scares away retail traders and reduces liquidity for optimal distribution. The rational strategy is to accumulate, pump during the privacy narrative, then distribute at the top.
**Odds of Success**
- **TP $16-18:** 65-70% probability
- **TP $20-25:** 45-50% probability
- **TP $28-31:** 20-25% probability
- **Stop-loss (<$12.40):** 25-30% probability

ZENUSDT Forming Bullish WaveZENUSDT is currently showing a bullish wave pattern, signaling potential continuation of upward momentum after a period of consolidation. This pattern reflects strong market structure and growing optimism among traders, suggesting that buyers are regaining control. The price has been forming higher lows with solid support from volume, which adds confidence to the potential breakout scenario. With good liquidity and investor activity, ZENUSDT appears poised for a move toward higher resistance zones in the near term.
The bullish wave pattern often indicates renewed buying pressure and a possible acceleration in price once key breakout levels are cleared. In the case of ZENUSDT, technical indicators point toward strengthening market sentiment, supported by rising demand and consistent trading volume. A breakout confirmation could trigger a sharp upward push, aligning with the expected gain range of 40% to 50%, as momentum traders look to capitalize on this emerging setup.
Investor interest in ZENUSDT continues to build as market confidence returns across major altcoins. The combination of healthy volume, solid technical structure, and positive price action suggests that ZENUSDT could be entering a new phase of bullish momentum. Traders focusing on medium-term setups may find this pair particularly appealing given its strong technical foundation and the potential for sustained upside in the current market environment.
✅ Show your support by hitting the like button and
✅ Leaving a comment below! (What is You opinion about this Coin)
Your feedback and engagement keep me inspired to share more insightful market analysis with you!
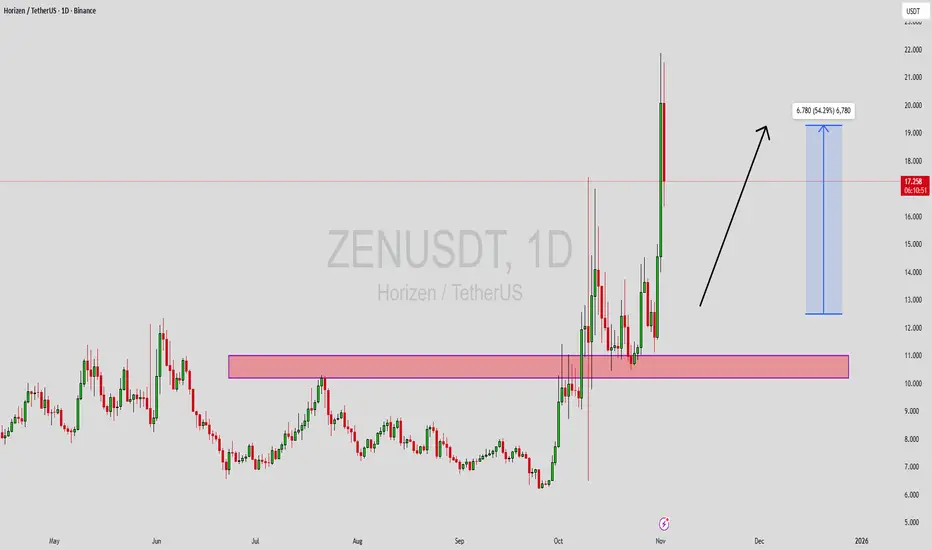
ZENUSDT PULLBACK ON TOPThe chart displays a strong breakout from a prolonged period of consolidation, marked by a descending trendline and several horizontal resistance zones. Prior to the breakout on November 1st, the price had been trading within a range, frequently challenging and failing to sustain a move above the roughly $14.00 - $14.50 resistance area. This level represented a significant hurdle, which was finally breached with notable momentum.
The current price action is characterized by a large, impulsive green candle, driving the price well above the previous highs near $17.00. This suggests strong bullish sentiment and a significant influx of buying pressure. The move has cleared all immediately visible overhead resistance, moving into a price territory not seen in the visible history of this chart section.
Price Projection
Given the sharp, parabolic nature of the recent surge, a pullback or retracement is highly probable as traders take profit and the market digests the strong move. The most immediate and significant potential support zone, previously a major resistance area, is located between approximately $16.00 and $17.00. This zone is crucial as it represents the last major swing high/resistance before the current move. The analysis projects a correction back toward this support zone.
The red arrow on the chart specifically suggests a move down to test the $16.00 - $17.00 area. A successful test and bounce from this range would confirm the former resistance as new, strong support, solidifying the recent breakout and paving the way for a continuation of the uptrend toward higher price targets. Failure to hold this support, however, could indicate a false breakout or a deeper correction, potentially back to the $14.00-$14.50 breakout level.
In summary, the immediate outlook is for a short-term pullback to confirm the breakout, followed by a potential continuation of the strong bullish trend.
