#ZEN/USDT Long plan#ZEN
The price is moving in a descending channel on the 1-hour timeframe. It has reached the lower boundary and is heading towards breaking above it, with a retest of the upper boundary expected.
We have a downtrend on the RSI indicator, which has reached near the lower boundary, and an upward rebound is expected.
There is a key support zone in green at the 296 price level. The price has bounced from this zone multiple times and is expected to bounce again.
We have a trend towards stability above the 100-period moving average, as we are moving close to it, which supports the upward movement.
Entry price: 9.27
First target: 9.52
Second target: 9.90
Third target: 10.36
Don't forget a simple principle: money management.
Place your stop-loss below the support zone in green.
For any questions, please leave a comment.
Thank you.
ZENUSDTPERP

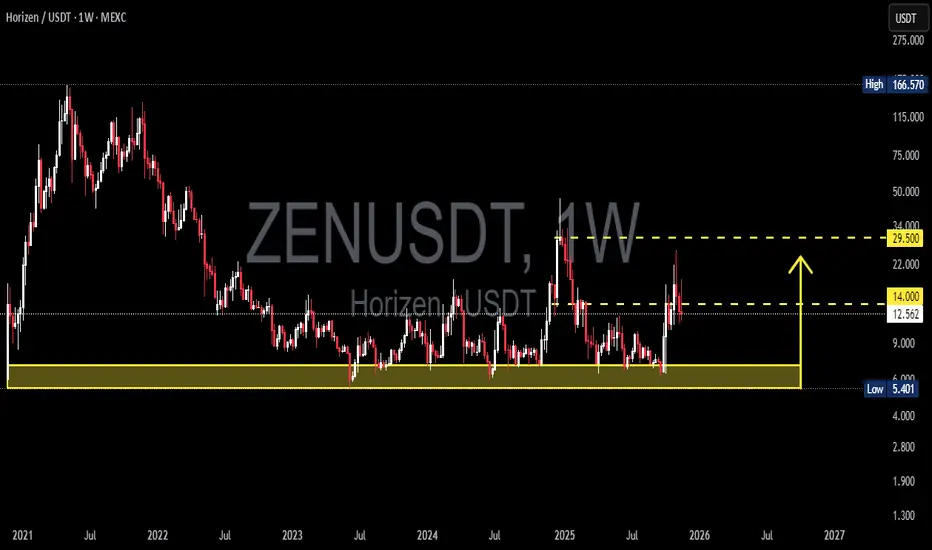
ZENUSDT: Multi-Year Base at 7–5.4 — Is the Major Breakout Near?ZENUSDT is now sitting at the most critical point in its multi-year structure.
Since 2022, every major move—every drop, every rebound—has returned to the same zone:
the accumulation base at 7 – 5.4, highlighted in yellow.
This isn’t just support.
This is the foundation of the entire long-term market cycle, a level that continues to hold despite multiple tests and high volatility.
Buyers have consistently defended this zone, suggesting strong long-term interest from deep-pocket participants.
Now, the structure is shifting:
Price has rebounded again and is pressing toward the key resistance at 14.0 — the level that decides whether ZEN stays trapped in its multi-year range… or begins a full trend reversal cycle.
A weekly breakout above 14.0 could unlock the path toward the next major liquidity zone at 29.5, created by the explosive vertical spike in 2025.
This chart is at a turning point.
---
📌 Major Pattern Highlights
1. Multi-Year Accumulation Base (7 – 5.4)
The strongest support on the chart; every deep wick has been absorbed here.
2. Volatility Spike & Imbalance (2025)
The breakout created a liquidity vacuum toward 29.5 — price is now attempting to re-approach that zone.
3. Compression Into Resistance (14.0)
A series of small higher-lows building pressure beneath the resistance.
This kind of coil structure often leads to an explosive breakout.
4. High-Timeframe Pendulum Range Reversal
The failure to make new lows often signals energy building for an upside expansion.
---
🟩 Bullish Scenario
Bullish confirmation = weekly close above 14.0.
If this happens:
Primary target: 29.5
(major supply zone + liquidity pool from the 2025 spike)
This zone has very little structural resistance → allowing for fast upward movement.
Potential shift into a mid-term bullish trend.
Important:
The breakout must show a strong candle body, not a wick-only touch.
---
🟥 Bearish Scenario
Bearish conditions only become valid if: Price closes weekly back below 7.0 — especially below 5.4.
If that occurs:
The long-term bullish structure collapses.
Market opens the door to new lows.
Sellers regain full control, marking the end of the accumulation story.
In simple terms:
5.4 is ZEN’s long-term survival level.
---
This chart represents a clash between multi-year accumulation and the leftover supply from the 2025 liquidity spike.
And right now, price sits exactly at the decision zone:
Will ZEN finally escape its 3-year sideways prison…
or get dragged back into the bottom range once again?
The next few weekly candles will shape the entire trend for Q1–Q2 2026.
#ZENUSDT #Horizen #CryptoTA #TechnicalAnalysis #WeeklyChart
#AccumulationZone #BreakoutSetup #MarketStructure
#LiquidityLevels #CryptoOutlook
$ZEN/USDT — Hold or Die Moment$ZEN/USDT — Hold or Die Moment
LSE:ZEN is currently testing a key trendline support — this level is absolutely crucial for its next move. If it holds successfully, we can expect a strong 20–40% pump in the short term.
However, if it breaks below, momentum could fade quickly.
Keep eyes on this level and trade with caution. Always DYOR and manage your risk!

ZENUSDT — Make or Break: Triple Bottom Formation or Breakdown?
🔎 Overview
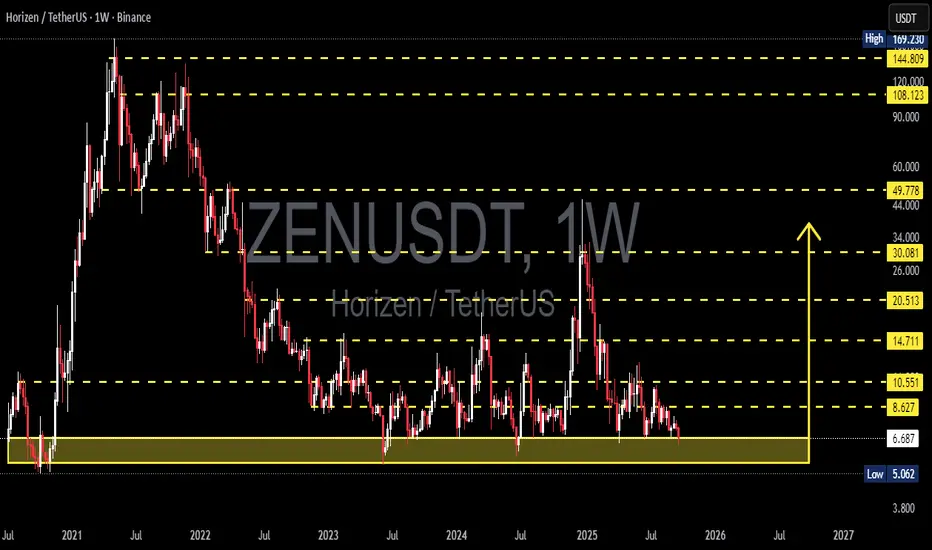
Horizen (ZEN) against USDT on the weekly timeframe is now trading at a critical juncture. After a long decline from its all-time high near $169 in 2021, ZEN is retesting the historical support zone at $5.06–7.00. This area has acted as a strong demand zone for years, making it the ultimate “make or break level” for its next big move.
---
📊 Technical Analysis
Key Support Zone: $5.06 – $7.00 (tested multiple times since 2020).
Major Resistance Levels:
Minor: $8.63 → $10.55
Mid-range: $14.71 → $20.51
Strong: $30.08 → $49.78
Extreme Bullish Targets: $108 → $169 (ATH).
Market Structure: prolonged sideways accumulation after a strong downtrend, with a multi-bottom pattern forming at the support area. Long wicks to the downside suggest buying interest, but no confirmed reversal yet.
Weekly Sentiment: neutral-to-defensive, waiting for breakout confirmation.
---
🚀 Bullish Scenario
If the support holds, ZEN could be forming a triple bottom / long-term accumulation base:
1. First confirmation: weekly breakout above $8.63.
2. Bullish targets step by step:
Target 1: $10.55 (initial resistance).
Target 2: $14.71 (supply zone).
Target 3: $20.51 → $30.08 (potential mid-term reversal).
Long-term: a breakout above $50 could open the way toward $100+.
💡 Note: Accumulation often comes with rising volume. A breakout with strong volume would validate the bullish case.
---
⚠️ Bearish Scenario
If the $5.06–7.00 support fails:
1. A weekly close below $5.06 would confirm breakdown.
2. Next downside target: $3.80 (psychological and technical support).
3. This would likely extend the macro downtrend and push ZEN into a deeper undervaluation phase.
---
📌 Key Patterns & Insights
Multi-touch support: the more it gets tested, the weaker it may become without new buyers.
Potential triple bottom: strong bullish reversal signal if confirmed.
Risk/Reward setup: trading near support offers a clear invalidation point (below $5.0) with a potentially large upside.
---
🧭 Strategy & Risk Management
Conservative traders: wait for a confirmed weekly close above $8.63 before entering, targeting $10.55 → $14.71.
Aggressive traders: consider partial accumulation in the $5.5–6.7 range with a tight stop below $5.0.
Risk control: use stop-loss, scale targets, and adjust position sizing to market volatility.
---
📌 Conclusion
ZEN is standing at a golden zone:
If support holds: strong chance of a rebound toward $10–20+ and possibly higher.
If support breaks: risk of a drop toward $3.8.
This is the level that will decide whether ZEN is preparing for a major recovery or facing another capitulation leg.
---
#ZENUSDT #Horizen #Altcoins #CryptoAnalysis #SupportResistance #TripleBottom #SwingTrading #Cryptocurrency #PriceAction
ZENUSDT TRADE IDEA.Chart Overview
Pair: ZEN/USDT Perpetual
Timeframe: 15 Minutes
Current Price: 9.472
Setup Type: Bullish SMC-based retracement entry
Strategy: Order Block + Fair Value Gap (FVG) + SSL sweep
📌
Setup Summary
A classic Smart Money Concept setup forming:
Bullish Break of Structure (BoS)
Sell-side liquidity (SSL) sweep below equal lows
Order Block (OB) + FVG convergence zone = POI (Point of Interest)
🧠
Explanation of the Setup
1.
Break of Structure (BoS)
Price broke above a key swing high, confirming bullish intent and initiating a market structure shift.
This is the first sign of institutional buying.
2.
SSL – Sell-Side Liquidity Sweep
Liquidity beneath equal lows has been swept before the bullish move, confirming that smart money grabbed sell orders to fuel buy positions.
This adds more confidence to the POI being a potential reaction zone.
3.
POI: OB + FVG Confluence
A clean bullish order block is formed at the base of the move.
A Fair Value Gap (FVG) exists in the same region — a sign of imbalance that often gets filled before continuation.
POI zone is marked between approximately 8.85–9.00 USDT.
4.
Price Action
Price is now retracing slowly, with bearish candles approaching the POI.
The expectation is a bullish reversal once the POI is tapped — targeting new highs above 9.80–10.20.
✅
Confirmation Tips
Before entering:
Look for bullish engulfing on 5m or 1m timeframe inside POI
Internal structure break (micro BoS) from the zone
Optional filters: RSI bullish divergence, volume spike, or trendline break
📌
Conclusion
This is a high-probability bullish trade setup with strong SMC logic:
Break of structure ✅
SSL sweep ✅
OB + FVG confluence ✅
POI identified ✅
It aligns perfectly with institutional trading behavior and offers a clean risk-managed entry.

ZEN/USDT Weekly Analysis: Major Accumulation Zone
🧠 Chart Analysis Overview (ZEN/USDT - 1W):
This weekly chart of Horizen (ZEN) against Tether (USDT) reveals a long-standing accumulation zone, and current price action hints at a possible bullish reversal from a critical support level. Let's break it down:
🟨 Key Technical Zone:
Support Zone (Accumulation): $5.06 – $7.06
This zone has acted as a major historical support area dating back to early 2021. Price has tested this zone multiple times and shown rejection, indicating strong buyer interest.
🔼 Bullish Scenario:
1. Price Rejection from Support:
A strong bullish wick and potential bounce from the $7.06 area signals accumulation and possible reversal.
2. Upside Targets (Resistance Levels):
$10.55
$14.71
$20.51
$30.08
$49.78
Long-Term Targets: $108.12, $144.81, $169.23
3. Pattern Indication:
The price action resembles a triple bottom formation within the accumulation zone — a classic reversal pattern. The yellow projection shows a possible V-shape recovery or rounded bottom scenario.
4. Trigger Confirmation:
A weekly close above $10.55 would be a confirmation trigger for continuation toward the next resistance levels.
🔽 Bearish Scenario:
1. Failure to Hold Support:
If ZEN fails to hold the $7.06 support zone and closes below the historical low of $5.06, the bullish structure invalidates.
2. Downside Risk:
Below $5.06, there's no significant historical support, suggesting a sharp drop is possible — potentially entering uncharted territory.
3. Bearish Breakdown Trigger:
Watch for weekly candle body close below $5.06 with volume — this could initiate further downside pressure.
📐 Pattern Summary:
Pattern Forming: Triple Bottom / Accumulation Zone
Type: Reversal Pattern
Timeframe Validity: Weekly – suitable for mid-long-term swing outlook
Volume Context: Not visible in chart, but confirmation from volume would strengthen the setup
🎯 Strategic Outlook:
Bias: Neutral-to-Bullish (While above $7.06)
Ideal Entry: Around $7.00 with tight invalidation below $5.00
Invalidation Level: Weekly close < $5.06
Take-Profit Zones: $10.55 → $14.71 → $20.51 → $30.08 → $49.78
#ZENUSDT #Horizen #CryptoReversal #AltcoinAnalysis #TripleBottom #TechnicalAnalysis #AccumulationZone #CryptoSwingTrade #SupportAndResistance #BullishSetup

ZENUSDT 1W Analysis ZEN ~ 1W Analysis
#ZEN Buy on retest of this support block with short term target of at least 20%+. This is the lowest support block for now.

ZENUSDT 1D AnalysisZEN ~ 1D Analysis
#ZEN Buy back gradually from here with a short term target of at least 15%+ from here.

ZENUSDT 1D AnalysisZEN ~ 1D Analysis
#ZEN Buy gradually from here if you still have a Conviction on this coin with a short -term target of at least 15%+ from here.

ZENUSDT 1WZEN ~ 1W Analysis
#ZEN Buy gradually from here if you still have a Conviction on this coin with a short -term target of at least 20%+.

ZENUSDT 1WZEN Update ~ 1W
#ZEN Retesting this support block,. If you still have Conviction on this coin,. buy back from here with a minimum target of 20%++

ZENUSDT: Two Blue Boxes, Two Opportunities!ZENUSDT: Two Blue Boxes, Two Opportunities! 🚀
ZENUSDT is presenting two crucial zones to watch:
First Blue Box: Perfect for a short-term upward move. A quick reaction here could bring solid gains for the nimble trader.
Second Blue Box: This is the big one! A visit here has the potential to spark new highs.
How to play this smart: Always confirm with CDV, volume profile, and lower time frame market structure breaks before jumping in.
Opportunities like this don’t wait. Be sharp, stay ready, and dominate the charts! Boost, comment, and follow for more insights. 💹
Let me tell you, this is something special. These insights, these setups—they’re not just good; they’re game-changers. I've spent years refining my approach, and the results speak for themselves. People are always asking, "How do you spot these opportunities?" It’s simple: experience, clarity, and a focus on high-probability moves.
Want to know how I use heatmaps, cumulative volume delta, and volume footprint techniques to find demand zones with precision? I’m happy to share—just send me a message. No cost, no catch. I believe in helping people make smarter decisions.
Here are some of my recent analyses. Each one highlights key opportunities:
🚀 GMTUSDT: %35 FAST REJECTION FROM THE RED BOX
🎯 ZENUSDT.P: Patience & Profitability | %230 Reaction from the Sniper Entry
🐶 DOGEUSDT.P: Next Move
🎨 RENDERUSDT.P: Opportunity of the Month
💎 ETHUSDT.P: Where to Retrace
🟢 BNBUSDT.P: Potential Surge
📊 BTC Dominance: Reaction Zone
🌊 WAVESUSDT.P: Demand Zone Potential
🟣 UNIUSDT.P: Long-Term Trade
🔵 XRPUSDT.P: Entry Zones
🔗 LINKUSDT.P: Follow The River
📈 BTCUSDT.P: Two Key Demand Zones
🟩 POLUSDT: Bullish Momentum
🌟 PENDLEUSDT.P: Where Opportunity Meets Precision
🔥 BTCUSDT.P: Liquidation of Highly Leveraged Longs
🌊 SOLUSDT.P: SOL's Dip - Your Opportunity
🐸 1000PEPEUSDT.P: Prime Bounce Zone Unlocked
🚀 ETHUSDT.P: Set to Explode - Don't Miss This Game Changer
🤖 IQUSDT: Smart Plan
⚡️ PONDUSDT: A Trade Not Taken Is Better Than a Losing One
💼 STMXUSDT: 2 Buying Areas
🐢 TURBOUSDT: Buy Zones and Buyer Presence
🌍 ICPUSDT.P: Massive Upside Potential | Check the Trade Update For Seeing Results
🟠 IDEXUSDT: Spot Buy Area | %26 Profit if You Trade with MSB
📌 USUALUSDT: Buyers Are Active + %70 Profit in Total
🌟 FORTHUSDT: Sniper Entry +%26 Reaction
🐳 QKCUSDT: Sniper Entry +%57 Reaction
📊 BTC.D: Retest of Key Area Highly Likely
This list? It’s just a small piece of what I’ve been working on. There’s so much more. Go check my profile, see the results for yourself. My goal is simple: provide value and help you win. If you’ve got questions, I’ve got answers. Let’s get to work!

ZENUSDT 1WZEN Update ~ 1W
#ZEN So far it continues to maintain its bullish structure. This is wave 4 in the Eliot Wave pattern. Minimum target 20%++

ZENUSDT Breaks Resistance: Bullish Trend AheadZENUSDT Technical analysis update
ZENUSDT has broken the trend resistance line on the daily chart after 300 days of a ranging market. The current price is trading above the 100 and 200 EMAs on the daily chart, with a noticeable rise in volume over the past few days near the resistance line. If the breakout is confirmed on the daily chart, a strong bullish move can be expected.

ZENUSDTZEN ~ 1W
#ZEN If you have Conviction on this coin,. Maybe you should consider making a purchase on this support block.

Zenusdt LongTrying a strong long here from 8.380.
looks like a strong deviation and if right on idea then it can be sent to 11 at least.
stopping if don't look good or doesn't hold 8.2.
Note: Not a Financial Advice

ZEN / ZENUSDTGood Luck >>
• Warning •
Any deal I share does not mean that I am forcing you to enter into it, you enter in with your full risk, because I'll not gain any profits with you in the end.
The risk management of the position must comply with the stop loss.
(I am not sharing financial or investment advice, you should do your own research for your money.)

ZENUSDTBINANCE:ZENUSDT SHORT IDEA
⛔"Daily crypto market analyses I provide are personal opinions & not financial advice. Trading carries risks, so do your own research & seek advisor's help. #DYOR"
Don't forget to like and comment.

🔴 ZEN - 4H (23.07.2023)🔴 ZEN - 4H
Both EPs have been triggered to short ZEN from 9.304. Starting to look a bit over bought.
Full setup as follows:
EP 1 - 9.304
EP 2 - 9.490
SL - 9.759
TP 1 - 8.783
TP 2 - 8.528
TP 3 - 8.289

ZENUSDT Short Trade!ZENUSDT Short Setup
Short level: Above $10.37
Stop loss : $10.62
Support 1 : $10.10
Support 2 : $9.60
Support 3 : $8.87
Thanks
Hexa

Awesome strong coin|ZENUSDTZEN/USDT
This one is very good for long term.
Old and trustly coin.
We are waiting for the pump
According my +39.9% in 2 weeks last idea the price goes like in the chart exactly
Add this coin to your watch list
Best wishes

ZEN (Horizen) Coin Analysis 15/03/2021Fundamentals:
Horizen is an interoperable blockchain system, supported by a decentralized node infrastructure. Its sidechain platform focuses on scalable data privacy, and as such enables businesses as well as developers to build private or public blockchains using the unique sidechain technology known as Zendoo.
Horizen launched in May of 2017 and strives to ensure data integrity and privacy through enabling real-world use cases. Horizen claims to be completely decentralized, fully customizable with privacy features and supports low costs associated with building blockchains with configurable revenue models and unlimited number of tokens and digital assets.
Horizen uses a sidechain architecture that can open up a myriad of potential real-world use cases. This cross-chain transfer protocol allows for decentralized sidechains. These are separate blockchains that are pegged to the parent blockchain that can run simultaneously.
Horizen has a mission of empowering people and bringing them closer together through the process of building an inclusive ecosystem where everyone can be rewarded for their contribution. Zendoo is the decentralized and customizable sidechain solution used to overcome current limitations regarding scalability and extensibility in blockchain. It is a parallel platform with enhanced features that enables the deployment of public or private blockchains at scale, and the SDK provides the components required to build a decentralized blockchain.
ZEN is the native cryptocurrency for the Horizen ecosystem.
The founders of Horizen are Robert Viglione and Rolf Versluis.
Robert Viglione is the co-founder and CEO of Horizen Labs, as well as the co-founder and president of the Zen Blockchain Foundation. He is a PhD Candidate of Finance in the University of South Carolina and worked as an operations research analyst at Lanmark Technology. He also worked as an advanced analyst at Tecolote Research and as a project manager at the United States Air Force.
Rolf Versluis is the co-founder and executive advisor of Zen Blockchain Foundation. He is an experienced business owner in the IT industry and owns a mid-size mining operation. In the past Rolf worked at Cisco systems, the semiconductor industry, and as a nuclear trained officer in the US Submarine force.
Jane Lippencott was a member of founding team and co-author of the original whitepaper. She is now an associate at Winklevoss Capital. She is also a 2021 VC Cohort at All Rise, as well as an advisor at Teller Finance. Jane is also a mentor at the Open Web Collective as well as a mentor at Celo and Katapult Accelerator. She is a contributor at Nakamoto.com. She worked as a mentor at Blockchain for Social Impact Coalition (BSIC), a mentor at dLab and a mentor at Ethereum Classic Labs, an advisor at Unbounded Capital, a mentor at Techstars, and was a member of the Board at Cord.
Technical Analysis:
as we can see the coin has done its Accumulation phases and now it is on its UP MOVE,
we are Longing it on its recent retracement and price correction where it can be presumed as another Reaccumulation phase
we are defining 3 targets where as the 3 targets gets Confirm as the price triggers the 2 Target followed by some distribution and price correction.

ZENUSDTPERP Trade 1Hi!
This is my first time trading ZEN/USDT.
coinmarketcap.com
Entry: 62.242
Exit: Sign of Rejection at 77.318 or candle close
EMA50 is holding and in daily time frame it is a support area and confluence with 0.618 reverse fib. Also it created a higher lower which gave us a better risk reward ratio.
