#ZETA/USDT Will go Short#ZETA
The price is moving in a descending channel on the 1-hour timeframe. It has reached the upper limit and is heading towards breaking downwards, with a retest of the upper limit expected.
We have an upward trend on the RSI indicator, which has reached near the upper limit, and a downward reversal is expected.
There is a major resistance zone in green at 0.08333. The price has bounced from this zone multiple times and is expected to bounce again.
We have a trend of consolidation above the 100-period moving average, as we are moving close to it, which supports a downward move towards touching it.
Entry price: 0.07660
First target: 0.07481
Second target: 0.07332
Third target: 0.07150
Stop loss: Above the resistance zone in green.
Don't forget a simple thing: money management.
For inquiries, please leave a comment.
Thank you.
Zeta

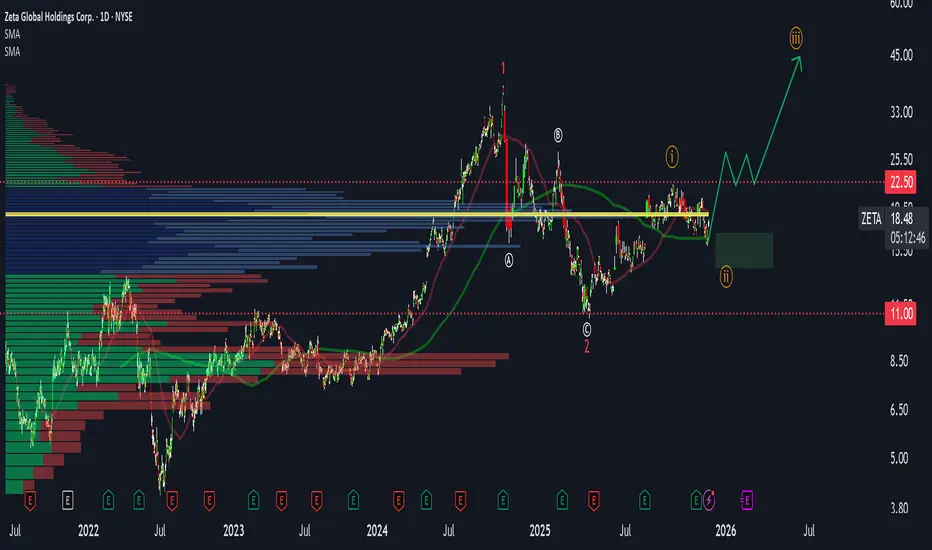
Zeta set up to see 32.00 or higherThis company continues to outperform under the radar. with the new open sea momentum we see the neckline broken on the head and shoulder, cup and handle break out, and cypher. This pattern is not new to zeta as you can see it has occurred in the past. I don't have stops in. but did show a tasty risk reward setup.

ZETA Looks Bullish (4H)It appears that a triangle pattern has reached its completion, followed by the formation of a bullish impulse wave, which can be labeled as wave A. After this upward move, the price has entered a corrective phase, which can be considered wave B.
Once wave B is completed, we expect another bullish move in the form of wave C for ZETA. This structure suggests a continuation of the overall bullish trend.
The target levels have been clearly marked on the chart based on this wave structure.
There are two identified entry zones, and the position should be built gradually using a DCA (Dollar-Cost Averaging) strategy.
A daily candle close below the invalidation level will invalidate this outlook and cancel the bullish scenario.
If you have a coin or altcoin you want analyzed, first hit the like button and then comment its name so I can review it for you.
This is not a trade setup, as it has no precise stop-loss, stop, or target. I do not publish my trade setups here.

#ZETA/USDT Critical Support
#ZETA
The price is moving in a descending channel on the 1-hour timeframe. It has reached the lower boundary and is heading towards breaking above it, with a retest of the upper boundary expected.
We have a downtrend on the RSI indicator, which has reached near the lower boundary, and an upward rebound is expected.
There is a key support zone in green at 0.06230. The price has bounced from this level multiple times and is expected to bounce again.
We have a trend towards consolidation above the 100-period moving average, as we are moving close to it, which supports the upward movement.
Entry price: 0.06624
First target: 0.06737
Second target: 0.06886
Third target: 0.07123
Don't forget a simple principle: money management.
Place your stop-loss order below the support zone in green.
For any questions, please leave a comment.
Thank you.

ZETA📌 Zeta Global shares consistently exceed expectations, increase margins, and aggressively capture the market, while remaining significantly undervalued at key multiples.
Unprecedented operational discipline: Zeta reported its 17th consecutive quarter of revenue exceeding guidance and improved guidance. In Q3 2025, organic revenue growth accelerated to 28% year-over-year.
Powerful synergies with Marigold: The $325 million acquisition not only added $190 million to the 2026 revenue forecast, but also strategically provides access to the customer loyalty of 40+ Fortune 500 companies and strengthens Zeta's AI platform with behavioral data.

The Bullish Inflection Thesis for Zeta Global Holdings Corp.An in-depth bullish thesis for Zeta Global Holdings Corp. (ZETA), recently articulated by Deep Value Returns, presents the company as a compelling "Inflection" investment opportunity. This strategy centers on identifying companies poised for a fundamental re-rating by Wall Street, capitalizing on periods of muted sentiment and depressed valuations before a cycle of accelerating growth and institutional rediscovery unfolds. At its core, the thesis argues that Zeta, currently trading around $18.25, offers investors an attractive entry point ahead of a potential multi-year recovery and rerating cycle, with a defined price target of $30 per share by early 2027.
Zeta Global operates a sophisticated omnichannel data-driven cloud platform, providing enterprises with powerful consumer intelligence and marketing automation software. The investment case hinges on the company's pathway to reigniting consistent, profitable growth and, in doing so, rebuilding the confidence of institutional investors. Market enthusiasm for Zeta has notably faded since its previous retail-driven peaks, but this reset in sentiment is precisely what creates the current mispricing and opportunity. The stock now trades at a forward P/E of approximately 17.9x, a valuation the thesis considers disconnected from the company's underlying potential.
The central financial projection underpinning the bullish view is Zeta's capacity to deliver approximately 20% revenue growth in 2026 while simultaneously expanding its profitability and free cash flow margins. This combination of robust top-line expansion and bottom-line discipline is a key catalyst historically sought by serious institutional capital. Despite this promising profile, shares trade at a modest multiple of roughly 26x next year's estimated free cash flow—a valuation deemed attractive for a software business capable of compounding revenue at a 20% annual clip. As expectations remain subdued, Zeta's strengthening fundamentals are positioned to gradually turn the company back into an institutional favorite, setting the stage for a meaningful valuation rerating as business momentum visibly accelerates into 2026 and beyond.
This investment premise aligns squarely with the defined "Inflection" strategy: purchasing early when market sentiment is washed out and fundamental improvements are underway but not yet fully recognized, then selling into strength as Wall Street analysts and large funds catch up to the story. The approach is disciplined and cyclical, involving the recycling of capital from previous successful investments (such as Unity Software) into new, underappreciated setups. It also acknowledges that not every selection will connect as planned, citing examples like Bill.com, Fiverr, and Atlassian where the thesis did not fully materialize. However, the strategy's demonstrated wins—including successful calls on Reddit, Astera Labs, Doximity, and Teladoc—illustrate the potent returns possible from disciplined execution when the inflection narrative plays out correctly.
The current thesis on Zeta builds upon and reinforces a previously covered bullish perspective from January 2025, which highlighted the company's resilience in disproving short-seller allegations and its durable competitive advantage rooted in a vast reservoir of first-party data. Since that prior coverage, Zeta's stock price has depreciated by approximately 2.6%, indicating the earlier anticipated catalyst timeline has extended. Crucially, however, the foundational thesis remains intact; Zeta's core fundamentals, growth drivers, and strategic positioning are unchanged. The new analysis from Deep Value Returns reinforces this view but places greater emphasis on the specific "muted-expectations" setup and the mechanics of the impending rerating cycle.
It is important to contextualize Zeta's stock within its characteristically volatile trading pattern. The shares have experienced 46 moves greater than 5% over the past year alone, indicating a market that frequently re-evaluates its near-term prospects. In this context, recent price movements, including a 6% gain 12 days prior linked to shifting Federal Reserve policy expectations, are seen as meaningful but not fundamentally altering the long-term perception of the business. That earlier move was driven by comments from New York Fed President John Williams, which bolstered hopes for interest rate cuts—a macroeconomic tailwind that typically benefits growth-oriented software stocks by lowering discount rates and boosting the present value of future earnings.
In summary, the bullish case for Zeta Global presents a calculated risk/reward proposition. It carries inherent execution and market sentiment risks, but the proponents argue the asymmetric upside—driven by a return to accelerated growth, expanding profitability, and a subsequent institutional reevaluation—far outweighs the potential downsides. With portfolio capacity available and market expectations firmly reset, Zeta represents a strategically aligned opportunity to invest in a software platform at a reasonable valuation, ahead of a potential inflection point that could drive significant shareholder value over the coming years.

I don't own enough!I don't own enough of NYSE:ZETA even with my massive 15-20% holding across my investment portfolios and leaps galore.
The fundamentals scream buy anything under $25-$30, while the stock sits at sub-$20.
P/S less than 3, DCF model spitting out massive Margin of Safety based on conservative projections, and they are about to report their first GAAP profitable quarter.
Never mind the chart that looks ready to have a blow-off top moment, friends absolutely.
Cup and Handle is ready to send us to new ATHs in 2026, from the looks of it.
This is a top-2 position for me, and I've personally met and interviewed the CEO, but I have no ties to the business beyond being a retail shareholder.
So take what I say as you may, and always DYOR, friends.
Not Financial Advice.
God bless!

Zeta Global (ZETA) – Strong Fundamental Rebound SetupNYSE:ZETA Fundamental Overview
Zeta Global continues to show strong improvement in fundamentals.
Revenue growth:
From 2021 to 2024 revenue expanded from 360M to 1B, which represents a stable annual growth rate of 25 to 30 percent. This is a solid pace for a company still scaling into profitability.
EPS momentum:
Starting from 2023 EPS began accelerating rapidly. It grew 40 percent in 2023, then 60 percent, and based on quarterly trends 2024 EPS growth is likely to exceed 100 percent.
Quarter over quarter EPS growth from mid 2024 has also been stable at around 25 to 30 percent.
Current EPS is 0.12 and the company is moving closer to full profitability.
Forward valuation:
Forward P/E sits around 18.73 which is attractive considering triple digit EPS growth projections. This suggests that the stock is undervalued relative to forward earnings potential.
Free cash flow:
Free cash flow continues to improve. Historically, when EPS was negative, the stock still traded around 30 dollars. Now with much stronger EPS the stock is only 18 dollars, which highlights a valuation disconnect.
Dilution risk – the main negative factor:
Since 2022 the company has been increasing share count by roughly 2 to 3 percent each quarter.
A major dilution happened in November 2024 when shares increased by roughly 30 percent, which triggered the sharp decline from 30 to 18 dollars. This is currently the main fundamental risk.
Technical Analysis
Price is still inside a broad accumulation range.
Two key volume clusters:
14 to 22 dollars
7 to 9 dollars
Current decline looks like a completed wave 2 correction with early signs of wave 3 formation.
Fibonacci structure:
Wave 2 typically retraces 38 to 62 percent.
The 38 percent level has already been touched, but price can still revisit 13 to 14 dollars which matches the subwave 4 zone of the previous wave 3. This creates a strong confluence support.
Entry and risk management:
Potential entry zone: 13 to 15 dollars
Stop loss: 11 dollars – below this level the structure becomes invalid
Targets:
22.5 dollars – high of wave 1
After breakout of this level: 38 dollars – global wave 1 high
If price holds above 38 dollars after retest, a much larger rally becomes possible as institutional accumulation typically unfolds above the breakout zone.
Conclusion
Zeta Global presents a rare combination of improving fundamentals and a potentially completed corrective structure on the chart. Dilution remains a notable risk, but the valuation gap and strong earnings trajectory create an attractive reward to risk scenario.
I am monitoring the 13 to 15 dollar zone for long entries with targets at 22.5 and 38 dollars.
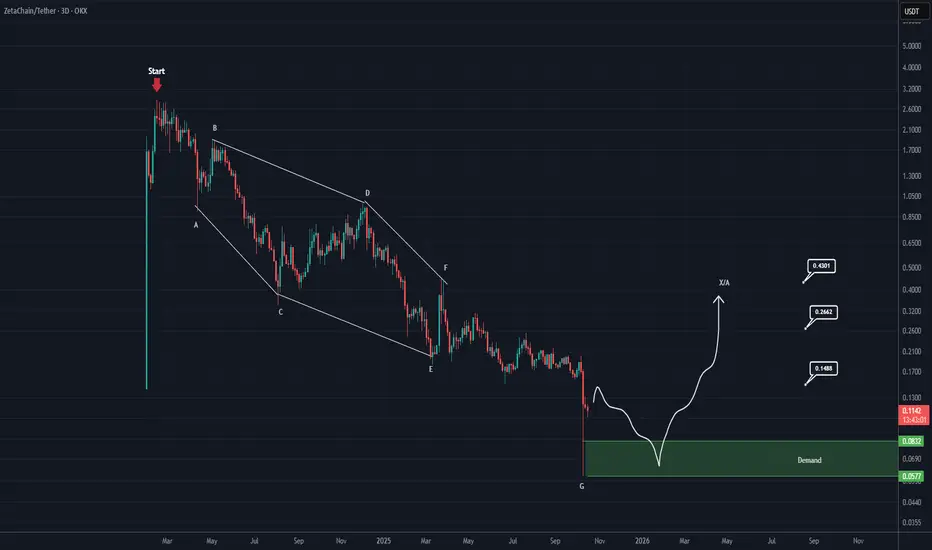
ZETA Analysis (3D)From the point where the red arrow is placed on the chart, it seems that ZETA’s correction has begun, and a diamond-shaped diametric pattern is nearing completion.
It is expected that the correction will end around the green zone, after which the price may enter a bullish phase — this phase could either be an X-wave or a multi-legged upward pattern.
Let’s wait and see how it unfolds.
For risk management, please don't forget stop loss and capital management
When we reach the first target, save some profit and then change the stop to entry
Comment if you have any questions
Thank You
#ZETA/USDT Critical Support#ZETA
The price is moving within a descending channel on the 1-hour frame, adhering well to it, and is heading for a strong breakout and retest.
We have a bearish trend on the RSI indicator that is about to be broken and retested, which supports the upward breakout.
There is a major support area in green at 0.1777, which represents a strong support point.
For inquiries, please leave a comment.
We are in a consolidation trend above the 100 Moving Average.
Entry price: 0.1800
First target: 0.1833
Second target: 0.1865
Third target: 0.1900
Don't forget a simple matter: capital management.
When you reach the first target, save some money and then change your stop-loss order to an entry order.
For inquiries, please leave a comment.
Thank you.

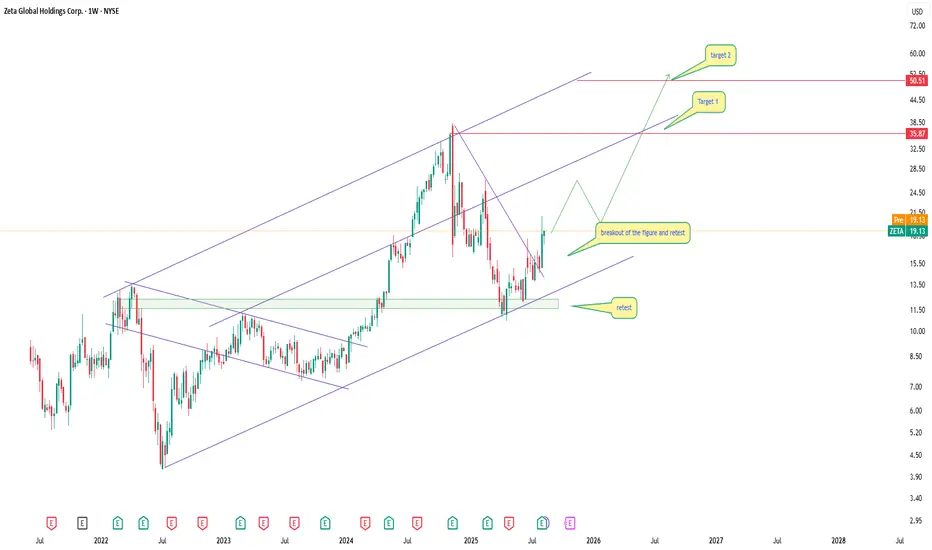
ZETA: when data-driven ads strap on a rocketTechnical analysis:
On the weekly chart, ZETA trades inside an ascending channel. After a deep pullback to the lower channel boundary (14–15$), the price bounced and consolidated above 19$, breaking the descending trendline. The nearest resistance is at 35.87$, and if broken, the next target lies at 50.51$.
EMA and MA on lower timeframes have turned upward, MACD shows a bullish crossover, and volumes are increasing. The upside potential remains strong as long as support at 15–16$ holds.
Tactical plan: buy from current levels and add on a retest of 18–19$, targeting 35.87$ and 50.51$.
Fundamental overview:
Zeta Global is a marketing and data-driven advertising company leveraging AI for targeted campaigns. The business benefits from the global digitalization trend and rising corporate spending on data analytics. Recent earnings showed revenue growth, improved margins, and reduced debt. Rising demand for adtech and institutional interest could further boost the stock.
Conclusion:
If ZETA breaks above 36$, it could jump into a higher price range, turning clients’ ad budgets into rocket fuel.
#ZETA/USDT Critical Support#ZETA
The price is moving within an ascending channel on the 1-hour frame, adhering well to it, and is on track to break it strongly upwards and retest it.
We have support from the lower boundary of the ascending channel, at 0.1960.
We have a downtrend on the RSI indicator that is about to break and retest, supporting the upside.
There is a major support area in green at 0.1985, which represents a strong basis for the upside.
Don't forget a simple thing: ease and capital.
When you reach the first target, save some money and then change your stop-loss order to an entry order.
For inquiries, please leave a comment.
We have a trend to hold above the 100 Moving Average.
Entry price: 0.2030.
First target: 0.2060.
Second target: 0.2104.
Third target: 0.2156.
Don't forget a simple thing: ease and capital.
When you reach your first target, save some money and then change your stop-loss order to an entry order.
For inquiries, please leave a comment.
Thank you.

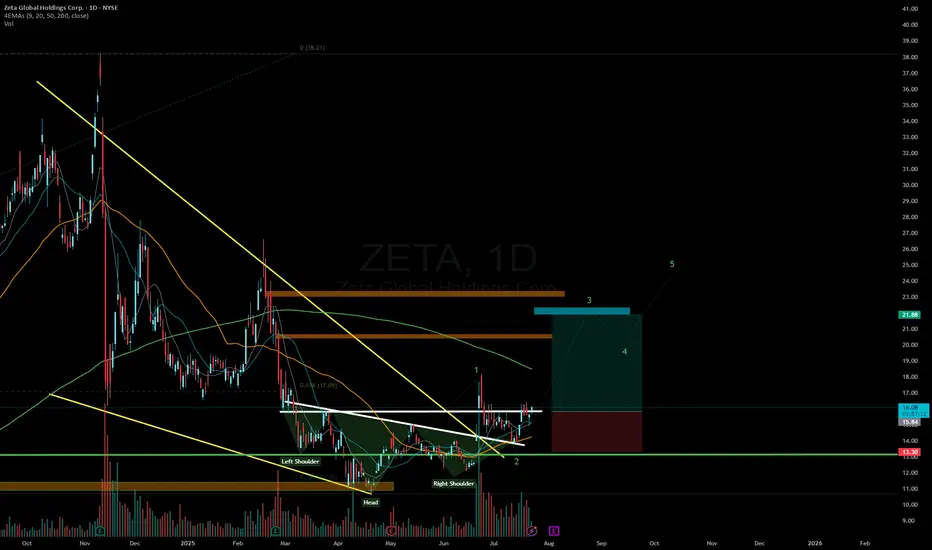
ZETA: when a wedge isn’t just a wedge — it’s a launchpadTechnically, this setup is textbook clean. Price completed the fifth wave within a falling wedge and instantly reacted with a bullish breakout. The expected breakdown didn’t happen — instead, buyers stepped in, confirmed by rising volume. All EMAs are compressed at the bottom of the structure, signaling a clear shift in momentum. The volume profile shows strong accumulation around $14, while the area above current levels is a vacuum — ideal conditions for acceleration.
The key resistance zone is $16.70–17.20 — former base highs and the 0.236 Fibonacci retracement. If price breaks this area with volume, the next stop is likely $24.48 (0.5 Fibo). Classical wedge targets land at $38.28 and $55.33 (1.272 and 1.618 extensions). If a trending leg begins, it could move fast — because there’s simply no supply overhead.
Fundamentals:
ZETA isn’t a profitable company yet, but it shows consistent revenue growth and aggressive expansion. Capitalization is rising, debt is manageable, and institutional interest has increased over recent quarters. In an environment where tech and AI are regaining momentum, ZETA could be a speculative second-tier breakout candidate.
Tactical plan:
— Entry: market or after a retest of $14.00–14.30
— First target: $17.20
— Main target: $24.48
— Continuation: $38.28+
— Stop: below $13.00 (bottom wedge boundary)
When the market prints a wedge like this and the crowd ignores it — that’s often the best trap setup. Only this time, it’s not for retail buyers. It’s for the shorts. Because when a falling wedge breaks to the upside with volume — it’s time to buckle up.

#ZETA/USDT#ZETA
The price is moving within a descending channel on the 1-hour frame, adhering well to it, and is heading towards a strong breakout and retest.
We are experiencing a rebound from the lower boundary of the descending channel. This support is at 0.1933.
We are experiencing a downtrend on the RSI indicator, which is about to break and retest, supporting the upward trend.
We are heading towards stability above the 100 Moving Average.
Entry price: 0.2014
First target: 0.2076
Second target: 0.2144
Third target: 0.2228

#ZETA/USDT#ZETA
The price is moving within a descending channel on the 1-hour frame, adhering well to it, and is on its way to breaking it strongly upwards and retesting it.
We are seeing a rebound from the lower boundary of the descending channel, which is support at 0.2386.
We have a downtrend on the RSI indicator that is about to break and retest, supporting the upward trend.
We are looking for stability above the 100 moving average.
Entry price: 0.2590
First target: 0.2682
Second target: 0.2800
Third target: 0.2935

#ZETA/USDT#ZETA
The price is moving within a descending channel on the 1-hour frame and is expected to continue upward.
We have a trend to stabilize above the 100 moving average once again.
We have a downtrend on the RSI indicator that supports the upward move with a breakout.
We have a support area at the lower boundary of the channel at 0.2400.
Entry price: 0.2435
First target: 0.240
Second target: 0.2526
Third target: 0.2435

#ZETA/USDT#ZETA
The price is moving within a descending channel on the 1-hour frame and is expected to continue lower.
We have a trend to stabilize below the 100 moving average once again.
We have a downtrend on the RSI indicator, supporting the upward move with a breakout.
We have a resistance area at the upper limit of the channel at 0.3088.
Entry price: 0.3022
First target: 0.2924
Second target: 0.2858
Third target: 0.2780

#ZETA/USDT#ZETA
The price is moving within a descending channel on the 1-hour frame, adhering well to it, and is heading for a strong breakout and retest.
We are seeing a bounce from the lower boundary of the descending channel, which is support at 0.3013.
We have a downtrend on the RSI indicator that is about to break and retest, supporting the upward trend.
We are looking for stability above the 100 moving average.
Entry price: 0.3140
First target: 0.3390
Second target: 0.3637
Third target: 0.3954

$ZETA will continue to climb up > $30 - Ignore FUD, accumulate like the whales 🐋
- Zeta Global Holdings Corp. (NYSE: ZETA) reported robust financial performance in the third quarter of 2024, with revenue reaching $268 million—a 42% year-over-year increase.
STOCK TARGET ADVISOR
- This growth underscores the company's strong market position and effective strategic initiatives.
- Analysts have responded positively, with Needham & Company LLC reaffirming a "buy" rating and setting a price target of $43.00, suggesting a potential upside of approximately 99.81% from the current share price.

ZETA bullish breakoutZEta has finally broken out from its long running bearish flat trend and broken its daily range
Lets see if it goes above 200 MA which will confirm the bullish reversal and entry at 23/24 would be great entry to catch the train to 30+

ZETA Critical Support#ZetaChain is showing bullish potential in its current price zone.
Breaking $0.341 invalidates the idea (stop-loss).
Passing $0.647 confirms a bullish trend.

ZETAUSDT 2DZETA ~ 2D Analysis
#ZETA In this 2D time frame is the lowest support for now, buy from here if you still have a convtion on this coin with a minimum target of 20%+
