ZILLIQA ON INTERSTING INCREASE TREND - LONG TRENDHello trading friends,
Zilliqa shows the interesting trend for a possible increase trend from 0,0800
Possible breakout with a higher time frame.
✅Like and subscribe to not miss a new idea!✅ Thank you
# Manage always your risk, nobody knows the future - all depending on Data, trends, and whale effect
All our charts are not advice and you are responsible for your own investment
Zil

Watch for inverse head and shoulders on ZILChart shows daily inverse head and shoulders possible. Just something to start watching for. My buy in and profit taking target are shown.

ZILUSD Touching TrendlineAn idea for ZIL
Green dotted line is the trendline being touched
This will hold as per fib circle touch also
Likely will result in an inverse H&S and then further upward movement
Which I have plotted with the green Bars Pattern

ZIL/BTC buy opportuniryHi followers,
ZILBTC bounced of support area, buyers are stepping in,
1st higher low formed, the pair may be forming the beginning of a new up trend.
Don't forget to manage your risk! 👌
Good luck and trade with care 🙏
If you like my content - 👍 Like, 💬 comment, 👆 follow and 👉 share!
❗❗❗
Disclaimer: This information is not a recommendation to BUY or SELL. It is to be used for educational purposes only!

ZILUSDT facing a strong resistanceAs you can see, the trend has touched several times, such a strong trend, but now facing a strong resistance above ( $0.06401 - $0.06498 ), which also happen to be an EMA 200 on a 2hr TF.
A break above would confirm a new high of this trend, but the supporting trend has been weaken, lets see if it could break, next support would be $0.05897 - $0.05466
Lets keep an eye

SKL- TREND WHALES ARE YOU READY FOR SKL NETWORK?... MTN 420Hello trading friends,
SKL has the chance to get pumped by whales - and this depending on more trends, not only history trend shows this, but more private signals that we use - shows SKL has a huge chance for this breakout. SKL is under trend what makes this coin more interesting.
I will be not surprised if this coin increase to a high amount, depending on the last study trend SKL is very interesting, not only for whales but also for normal users also.
Know that this coin choice by watch trend as the top coin with an increasing trend.
We know there is noting called 100% into crypto - but this is our trend and use expecting - you should do your own study, and manage your ris k.
Have a great coffee time!
Follow/like for more trends.

ZIL in 1D | Great Situation for Shortthis is not a signal. Its just my opinion. Dont open your positions Based on my ideas! BINANCE:ZILUSDT
💎 #ZILUSDT
⌛️ #D
💲:entry_price : 0.059
🎯 targets:
TP1:0.048
TP2:0.045
📈 #SHORT
🚫stop_loss: 0.065
✖️Leverage: 5x
🔳Capital: 3%
💠Details: Zil is breaking its Static Support and 1.618 line of its pitchfork. the next target is mentioned on the chart.
zil coud not break its dynamic Resistance. so i expect a good short position

Zil - btcMajor support zone coming up for $zil #btc pair. I dont see any big support in between, maybe but round 185, but looks like bearish move to support and hopefully a strong bounce on daily there and confirmation of a green daily after, to go up again. Entry between 160 - 170

ZIL - Long Term Pattern Showing Again - Keep An Eye on This!Zilliqa is one of my favourite charts to trade as it runs a very simple pattern generally of pumps and consolidations.
Indeed, we've got some history:
And now it looks like we've got a massive cup and handle on the weekly chart. This could be a MASSIVE move when this pattern breaks.
Volume is declined, RSI is bottomed but relatively still in a strong spot. We're below all EMA's but a correction back up will lead us right into a breakout.
Fundamentally ZIL is big for tokenization and with the NFT sector coming back strong from it's crash this is a chart to keep eyes on over the coming weeks.

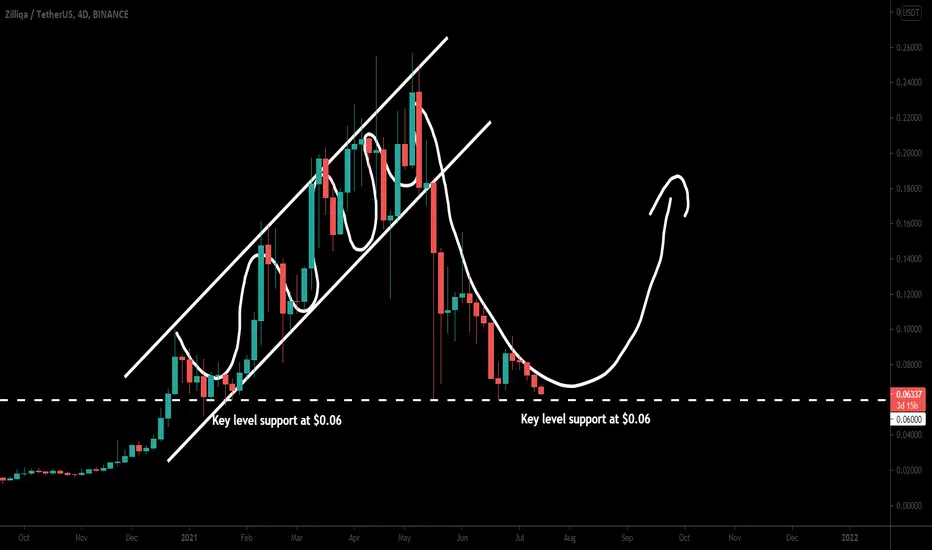
It Can Be Another Classic Move Of Zilliqa (ZIL)Brokedown the channel and key level support:
The price action of the Zilliqa coin was previously moving in a very long up channel. After breaking down the support of the channel the priceline turned is very strong bearish but found very strong support at $0.06. The $0.06 is key level support for the price line of is Zil. Because it has been working previously as very strong support for the price action for a very long time period. It can be seen that before the formation of the up-channel for several days the $0.06 level has been working as very strong support. Therefore, it will be very difficult for the PI fine to break down the support.
Big bullish BAT:
On the weekly time frame chart, the price action has formed a bullish BAT.
The buying targets as per the Fibonacci sequence of this bullish BAT can be as below:
Buy between: $0.0948 to $0.0745
Sell between: $0.1433 to $0.2161
As per the above targets, this trade has a profit possibility of up to 190%, and the loss possibility is 22%. It can be seen that on the weekly chart, the priceline is moving below the potential reversal zone of the bullish BAT but there is a very strong key level support at $0.06. Therefore, we can set this level as stop loss, rather than the maximum extent of the potential reversal zone and follow the sell targets as per the bullish BAT pattern.
Zilliqa (ZIL) formed bullish BAT for upto 30% moveHi dear friends, hope you are well and welcome to the new update on Zilliqa (ZIL).
On the daily time frame chart, the price action has formed a bullish BAT.

$ZIL DEVELOPMENTSzilliqa at the 50 week moving average of lows - will this become support?
3 weeks of positive macd histogram

ZIL-BTC$Zil had a fake 4h break out of the trend, went back under again and now below fib. Needs to bounce up in next 4h to be able to break trend again in next day(s). If it does, it will move quick. Just like lot of other alts. Takes a while sometimes, but they all break by 5 to 20 or 30% in a day. Just keep tight stoplosses, and trail your profits so you max m out. Don't hold too long, or but and hold for very long ;)

ZILUSD Micro gains before macro gains. Great Ecosystem.Nicely undervalued project with a powerful ecosystem. Bullish in short and long-term. Go Zilliqa.

ZIL-BTC$Zil hoovering above important fib level, and still trying to break that trendline. Touched multiple times last weeks, in downward movement. So a break above will be strong move upward. PRob wont even need a retest as support but could go straight to next fib level around 275sat

ZILLIQA BREAK THE IMPORTANT LEVEL!!In this Technical Analysis, I would like to tell you guys that we already broke the Descending Triangle Pattern on 4H Timeframe, and also the Ascending Channel Support on Daily Timeframe.
This actually could sign a very bad situation on Zilliqa.
However despite of this bad situation I also found an interesting pattern.
It's a Falling Wedge Pattern on the Daily timeframe.
This actually can be good for Zilliqa. At least we now can see the possible Resistance for Zilliqa move in the next few days.
Disclaimer : This is not Financial Advise

ZIL/USDT- Will be break and out of the channel soon.
- We will see consoludations in channel.
- Action depends on volume .
- Targets signed.
*Please share your opinion on it, write in the comments.
Teşekkürler.

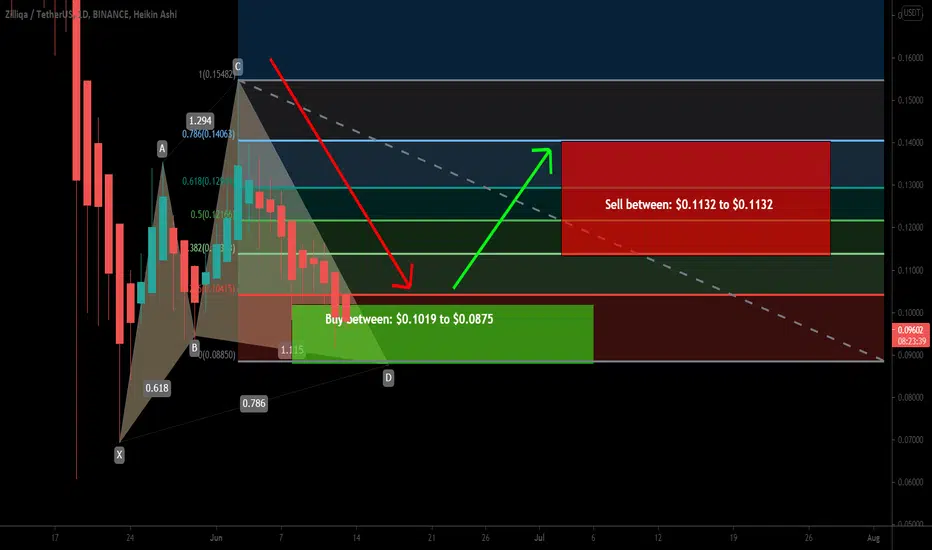
Zilliqa formed Cypher for upto 29% bullish moveHey dear friends, hope you are well, and welcome to the new update on Zilliqa (ZIL) coin with US Dollar pair.
Previously we had a nice trade of ZIL coin on 26th May:
Now on the daily time frame chart, the price action of ZILLIQA has formed a bullish Cypher pattern.
Buy and sell targets:
Buy between: $0.1019 to $0.0875
Sell between: $0.1132 to $0.1132
Stop loss:
The maximum extent of potential reversal zone $0.0875 can be used as stop loss.
Possible profit and loss ratio:
As per the above targets, this trade has a big profit possibility of 29%, and the loss possibility is 14.5%.
Note: Above idea is for educational purpose only. It is advised to diversify and strictly follow the stop loss, and don't get stuck with trade.
Going long ZILBTCZIL has been in a nonstop uptrend for months. And now is a chance for me to grab it at a discount just above the 0.382 FIB with a target just below the 0.786 FIB.
Notice the buy volume has always been much higher than the selling volume across the board.

ZIL bullishZIL at 360 resistance and look bullish to get above it today. Buying some here and leaving average cost order at 315 in case of rejection and dump. That will allow to reduce position size or exit it fully at 335 SR.
Day chart for zoom out view (mainly because of day chart I assume drop to 300-315 is possible)


Zil Final TargetBased on the Fibonacci timeline and the one-year Zil channel
I imagine such a scenario for Zil
I think Zils final target is between 5.2 and 6 or even 6.4
But about 5.5 $ seems to be closer to reality.
good luck

Buy ZIL#ZIL
ENTRY: 12800 - 13100
TARGET: 14800 - 16300
Stoploss: 11839
Zil is beautiful now. Good volume. Time for it wake up
