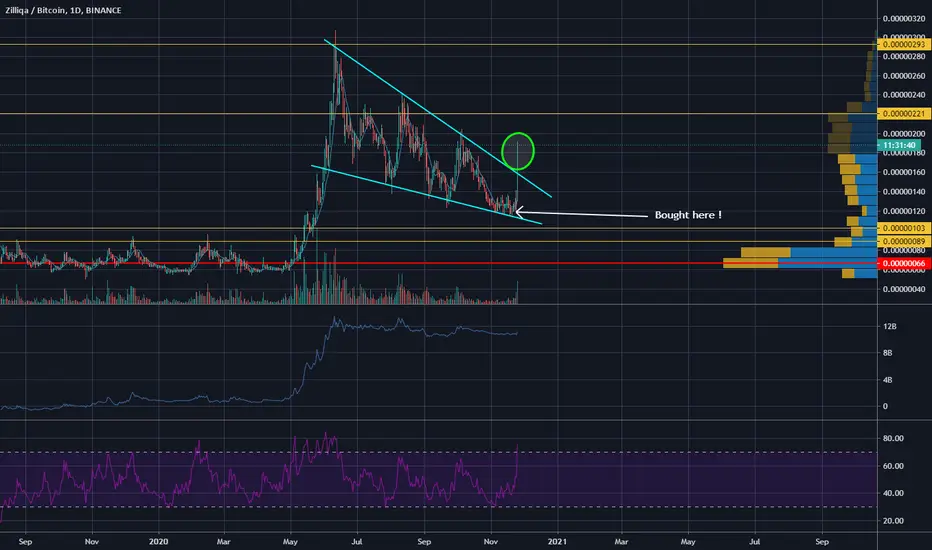
ZIL breakout ascending wedgePlease feel free to share your view on this pair down below in the comment section. I'm more than happy to be challenged and have an interaction on this idea.
Also make sure to leave a like as it helps me out a lot!
------------------------------------------------------------------------------------------
- Zilliqa broke out of ascending triangle
- No real resistance until 200 sats (small resistance at 185 sats).
- Setting higher highs & higher lows
I will look for a retest to the support drawn on the chart and take a long with my SL just below 165 sats)
Zil

ZILBTC formed bullish Shark | Upto 61% move aheadHey friends, hope you are well and welcome to the new update on Zilliqa coin.
On a daily chart, the price action of ZIL has completed the final leg of bullish harmonic Shark pattern and entered in a potential reversal zone.
Buying And Sell Targets:
The buying and sell targets according to the Fibonacci sequence of harmonic Shark pattern should be:
Potential reversal or buying zone: 0.00000132 to 0.00000115 btc
Fibonacci projection or sell zone: 0.00000149 to 0.00000186 btc
Stop Loss:
The potential reversal zone area that is up to 0.00000115 can be used as stop loss in case of complete candlestick closes below this level.
Possible profit and loss ratio:
As per above targets, this trade has a profit possibility of 61% and as per the above-mentioned stop loss, the loss possibility is 13%.
Note: The idea above is for educational purpose only, do not take it as investment advice.

ZIL/USDT Major PotentialZIL/USDT is recovering sharply from this week's dump. With sufficient volume, the price could reach the most recent highs again.
My conservative aim would be to place your target around Resistance 1, a nice 13% return from the current value. A more risky bet would be to have your target at the second resistance, placed at the last week's highs, netting a 26% return.
There's a lot of volatility in the crypto markets at the moment, trade carefully!

ZIL LONG TradeZIL has got out of the structure, a huge bull run can be expected.
Disclaimer:
This is just a personal opinion, and it is only for entertainment. Use it at your own risk!!!

Zilliqa falling wedge breakout setupzilliqa really good fundamental project
once price close above the if we breakout above trend line and touch 170+ it's our breakout
after breakout add your entry around 161 - 165 and wait for entry also buy small amount around 168 saotshi

Zilliqa Falling Wedge SetupPrice break the weekly trend line and looks absolutely bullish with really good volume
will open ladder order in this coin for mid term

After amazing call on ZIL ..what next ?Hello friends
after amazing call on zilliqa (ZIL) few hours ago
You can see here my original idea before breakout :
I told you to buy at break ..
the price was mooning after breakout and give us around 20% profit after break only
Many members ask me what are next moves or targets
You can see in chart i expect zil to retest the trend again and most likely it will be a successful retest
If that happens will be a good opportunity for another big move
Toward 220-300 sat (short - mid term)
⛔Dont forget the stoploss
I hope my ideas help you in your trading
Good luck 🌹

ZIL - Look out Tokyo, Here Comes GodZilliqaNow HERE is a textbook example of a Cup and Handle that's about to end. I mean if you want to learn some basic trading, here it is.
Cup and handle is a formation that's represented by a U shaped recovery or the cup, followed by a consolidation period representing the handle.
Then we go up
We've been in a historic accumulation area for weeks now.
Volume has absolutely tanked.
Actually every indicator on this chart points to a breakout. Easy catch.
This isn't financial advice. 🤙

HEADS UP !! Ziliqa breaking out !!Very powerful break out today !!
Happy I loaded the truck (+100% of my position) at the right moment !!
✳️Zilliqa/USDT (22/11) View + Trading Plan #ZIL $ZILZIL has just got out of the downtrend and is heading towards the 0.025-0.026$ zone, and it needs to confirm the uptrend by conquering this zone.
The 0.02$ zone is now reliable support, which can push up ZIL easily
📈BUY- LONG
-Buy: 0.02-0.021$, SL if B
-Buy more: 0.025-0.026$ if A
📉SELL-SHORT
-Sell: 0.025-0.026$, SL if A
-Sell: 0.034-0.035$, SL if A
♻️BACK-UP
-Sell close to 0.02-0.021$ if B, SL if A
-Buy: 0.016-0.017$, SL if B
-Sell close to 0.016-0.017$ if B, SL if A
-Buy: 0.012-0.013$, SL if B
❓Details
Condition A : "If 1D candle closes ABOVE this zone"
Condition B : "If 1D candle closes BELOW this zone"

ZIL / BTC add to your watchlistZIL / BTC
🌟 TECHINCAL ANALYSIS🌟
The coin was in Long downtrend on gaint falling wedge For More than 5 months
Expected big move soon ....
Market makers start to pump alot of coins
We can see big green candel today on ZIL/BTC chart ...price got rejected exactly at trendline
But not a buy signal yet .. need to breakout first / retest before entery
And some others bullish signs on small time frames
So keep it in your watchlist
Good luck and happy trading 🌹


ZILUSDT_DailyPrice:0.022 USDT
Entry LVL: 0.019-0.021 USDT
TP_LVL I: 0.027-0.029 USDT
SL: 0.018 USDT
Expected Return: 35 %
Reward/Risk: 3.49


ZIL Zilliqa potential breakoutZIL has a chance to make another leg up, after a long consolidation period. approaching the .786 line, ZIL has already confirmed a buy when crossing the 8ema with a 8/21 cross on the daily Time frame - November 6th. forming a very large inverse head and shoulders, a bullish signal has flashed once again. A break past the .786 with close and hold confirmation could lead to some very nice gains. 60% gains to $.035 are possible with the correction conditions being met. thanks for looking!

ZEC/USD Shows Clear Trend Behavior - Explanation How To TradeAll information about this ZEC/USD long trade can be found on the chart. I tried to make it as self-explanatory as possible. Should you have any questions, feel free to drop a comment or send me a personal message.

ZILUSDT - Potential buy entry 🔼ZILUSDT is printing an ascending triangle pattern at the mid region of the major descending channel.
Buy entry ⬆️ - breakout above the ascending triangle resistance.
Target - major descending channel resistance.

ZIL| Scalp Trade Short SetupHello Dear Traders,
on 4hr basis we have zil short setup.
entry exits are in chart above
this trade is valid for 2 days

ZIL/USDT 4 Hour ChartZil is coming down a bit further with before we should see a trend reversal. This particular pattern resembles a "Scythe" and is one of my patterns I created. Targets are laid out for the movement and the slight pullback levels. We can also see what appears to be a bull flag formation that is almost complete on the RSI. If you like the idea hit me with a like and if you disagree share why you do and follow for more updates
Cheers

Updated: ZIL still bearish. Corrective wave C underway.Bearish market sentiments not helped by increasing fresh wave of Covid19 infections, lockdowns across the globe, and lack of stimulus.


