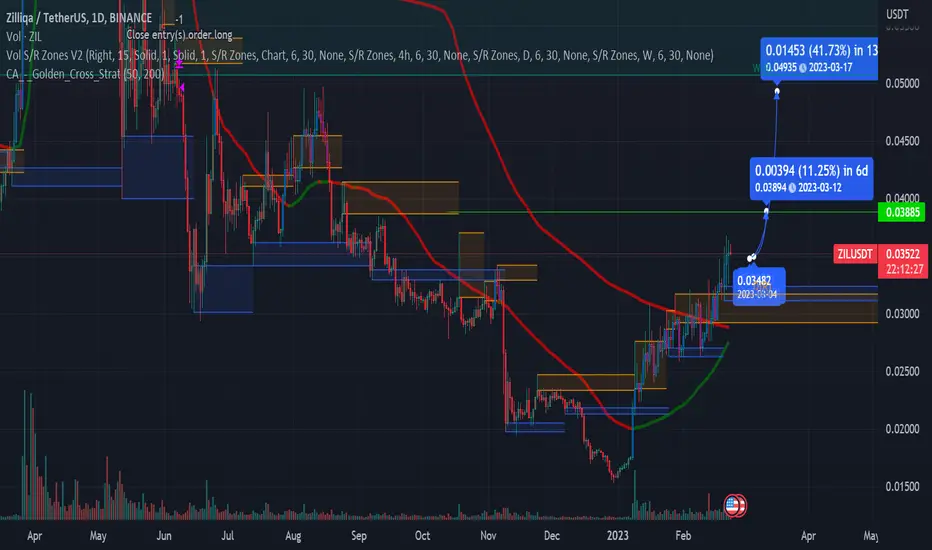
Zil wants breakout?Hello traders, everything is clear on the chart,
please manage your risk and enjoy trading <3
Zilliqa

ZIL/USDT TRADE SETUP! 60% PROFIT POTENTIAL!!Hello everyone, if you like the idea, do not forget to support it with a like and follow.
If you follow me then you must make some good money in the past few days. If you are reading my post for the first time then I tell you, I have shared many Alts like ARB (50% UP), BNX 30% UP), HOOK (50% UP), EGLD (15% UP), SAND (15% UP), and many more. You can check all these setups in my profile.
Remember this is just the start of the Altseason so do not Fomo As I said this is Altseason not an Alt day so we get more and more opportunities in the upcoming months.
Here is our new setup.
Welcome to this ZIL/USDT trade setup.
ZIL looks good here. Breaks out from the cup and handle pattern and currently retesting the neckline. Also, they will launch EVM Compatibility next week. So I'm expecting a good pump from ZIL in the next few days. Buy some here and add more in the dip.
Target1:- $0.036
Target2:- $0.040
Target3:- $0.044
Target4:- $0.050
SL:- $0.0295 (Do not trade without SL)
Buy on spot or you can use low leverage with strict SL.
If you like this idea then do support it with like and follow.
Also, share your views in the comment section.
Thank You!

Crypto ZILUSD (The UPtrend is intact)
View On ZILUSD (18 Apr 2023)
ZIL is in
* Slightly Bullish in short term (Intraweek)
* Slightly Bullish in Mid term (1 to 3 months)
* Bullish in Long term (3 months onward)
ZIL is in the decent UPtrend and we have ample of support of nearby.
Good supports are 0.028 and 0.022 will be good supports.
Sooner or later, it shall go UP further.
0.036 will be the next good resistant.
DYODD, all the best and read the disclaimer too.
Feel Free to "Follow", press "LIKE" "Comment".
Thank You!
Legal Risk Disclosure:
Trading crypto, foreign exchange or CFD on margin carries a high level of risk, and may not be suitable for all investors.
The high degree of leverage can work against you as well as for you.
Before deciding to trade foreign exchange you should carefully consider your investment objectives, level of experience and risk appetite.
The possibility exists that you could sustain a loss of some or all of your initial investment and therefore you should not invest money that you cannot afford to lose. You should be aware of all the risks associated with foreign exchange trading, and seek advice from an independent financial advisor.


#ZILUSDT bullish positionFast movement and slow correction on the trend line can be a good sign for ZILUSDT to go up
Convenient location with excellent R/R
Enjoy

$ZIL SHORT , lets short this Bitcoin is on the verge of visiting the bottom of the channel and a short to ZIL seems like a good idea.
ZShort

✳️ Zilliqa Mapped Out (300% - 580% Potential)This is a simple one. After May 2020 ZILBTC has been trading above 92 sats.
Each time this level is activated a reaction takes place and we see a bullish wave.
This level was activated in Dec. 2022 and now again this week.
The support range is 90-92 sats (0.00000090 - 0.00000092). Green above it.
If it goes below, drop it.
Easy.
Enjoy your weekend.
Namaste.
ZLong

ZIL to retest channel resistanceNow days everybody wanna talk like they got somethin to say but, but ZIL comes out when they movin' their lips.... ZIL still relatively close to channel support. A flip above the MACRO POC will send the PA toward the channel resistance level. Don't miss out on this SLEEPING GIANT GEM ZIL!!!

ZILUSD - Similar BottomsSimilar higher low bottoms, price is attempting to breakout of a strong downtrend
Good for the bulls, much less for the bears
Horizontal lines intersect with each bottom point
Z

ZILL/USDT Relative Strength Index Zill / USDT 3h Binance pair Shows Long Position , Because Relative Strength Index reverse after touching 30% lowest bar mostly Time Frames Shows Long Position According to RSI expect of 1day . if you have any other idea abour zillqa plese share your idea.

ZIL TO BUY AND TARGET 0.034 PRICEZILUSDT Analysis
On the 1H timeframe market is at bullish and we are seeing price respected Trendline and we are seeing a new uptrend. so in a few days price will go up to R1 and after some retracement, it will target 0.034usdt.

Zill golden crosszilliqa is ready to pull one of its famous pumps after this golden cross...maybe but technical indicators show a probable 40% there is a bit of resistance between here and there MARKED OUT ON CHART

$ZILUSDT: Low risk buy signalWeekly trends have often been a good way to ride crypto swings, so I keep an eye on them. Nice setup here in Zilliqa's chart.
Best of luck!
Cheers,
Ivan Labrie.

ZILUSDT can produce a massive jump of nearly 60%ZILUSDT resistance became the support, while the price continues to produce HHs and HLs. This is a strong bullish pattern and there should be a continuation of the uptrend, potentially going exponential.

$Zil Either wayDoesn't matter wich way it goes
Orders both ways
There's 8% swing to the upside if btc holds 21.5
There's 12% swing to the downside if .026 support fails

ZIL Ascending Triangle Above TRAMAZil/USDT Create Ascending Triangle on Binance 4h Chart pattern above the Trama
Ascending Triangle
The ascending triangle is a bullish formation that usually forms during an uptrend as a continuation pattern. There are instances when ascending triangles form as reversal patterns at the end of a downtrend, but they are typically continuation patterns. Regardless of where they form, ascending triangles are bullish patterns that indicate accumulation.
Because of its shape, the pattern can also be referred to as a right-angle triangle. Two or more equal highs form a horizontal line at the top. Two or more rising troughs form an ascending trend line that converges on the horizontal line as it rises. If both lines were extended right, the ascending trend line could act as the hypotenuse of a right triangle. If a perpendicular line were drawn extending down from the left end of the horizontal line, a right triangle would form.

Zilliqa has formed a H&S and a small double-topI think that Zilliqa has formed a small double-top pattern and a slanted head and shoulders pattern. Therefore, I can't rule out a situation where it retreats by about 15%.
ZShort

Zilliqa (ZIL) formed a bullish Gartley for upto 19% pumpHey dear friends, hope you are well, and welcome to the new trade setup of Zilliqa coin with Bitcoin pair.
Previously we caught more than 420% pump of Zilliqa as below:
Now on a 4-hr time frame, ZIL has formed a bullish Garrtley pattern.
Note: Above idea is for educational purpose only. It is advised to diversify and strictly follow the stop loss, and don't get stuck with trade
ZLong

ZILUSD Bottom? An idea for ZILUSD suggesting a bottom on a place along horizontal that was previously support
This support can be seen with the inverted Head and shoulders structure. I have not highlighted this however.
Price is still within a down channel so lets see if there's a reversal
Z

ZILUSDT Analysis - 11 JANUARY 2023Hello Guys, Today's Analysis is on the ZILUSDT Symbol in a 1H Time frame, I Hope it Will be Useful for You, Don't Forget to Like, Follow, Comment

Is it Bulls' Time for ZIL?Looking at the daily chart of ZIL/USDT, the ZIL price was swinging from $0.01541 to $0.03426 within the past 30 days after going to its lowest of the month at $0.01541.
Bouncing back from the support level, ZIL is trading in the previous order block formed on 08 November 2022. If ZIL is able to break out of the order block and rises higher, we can expect ZIL to reach $0.05.
Meanwhile, our long-term ZIL price prediction for 2023 is bullish if it cannot break the support level. We can expect ZIL to reach $0.06 this year.
If ZIL cannot break the $0.03047 resistance 1 level, the bears may seize control and dethrone ZIL to a downtrend stance. In simple terms, the price of ZIL might fall to almost $0.01621, indicating a negative signal from the previous support level.

