ZK - Long ideaBINANCE:ZKUSDT.P
Zk idea! This is not a setup. It's just an idea. If we create a similar model, then we're in. If we fail, we skip it.
Zk

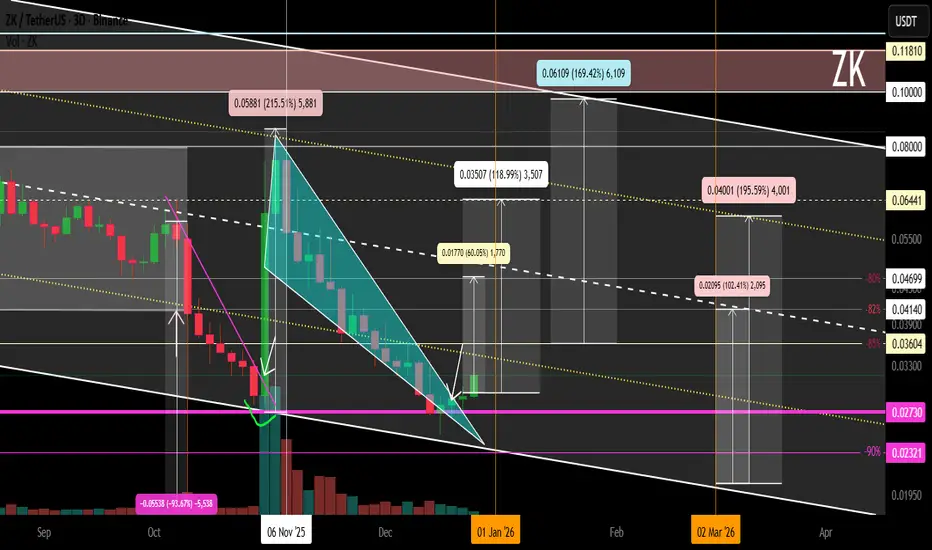
ZK Local Trend. Wedge. Reversal Zone and %. 2025 12 27Logarithm. 3-day timeframe.
Main trend for clarity (lower zone of the descending channel).
Declines from the high ("funds are buying 458 million worth of nothing") - 90%.
The long squeeze, due to the extremely low liquidity of the former hyped "saving the world" instrument, was carried out by a phenomenal -93% on a half-empty order book.
Secondary and local trends .
The key is a breakout of the descending wedge and local resistance zone.
Reversal zones and % of key support/resistance levels for building a trading plan and risk management.
Most market participants find it very unpleasant and difficult (they can't bring themselves to) to buy low (fear) and sell high (greed). For them, it's the other way around.
Manage your risks and stick to your trading plan. Don't get caught up in market and news noise, which shapes the opinions and illogical actions of the majority, who are doomed to lose in the future.
ZK is approaching its lows. I'm expecting a rebound. Full plan.ZK is slowly approaching its lows. It is dangerous to enter at the current level because the RSI clearly shows that we are approaching it.
I have marked the approximate buy zone in green and indicated the stop zone. Please proceed with caution.
I have also shown the targets for taking profits on the chart, so you can make informed decisions. Personally, I will exit at the first zone and move the stop to BU. If it goes up, great! If not, we've already made money with stops at BU.

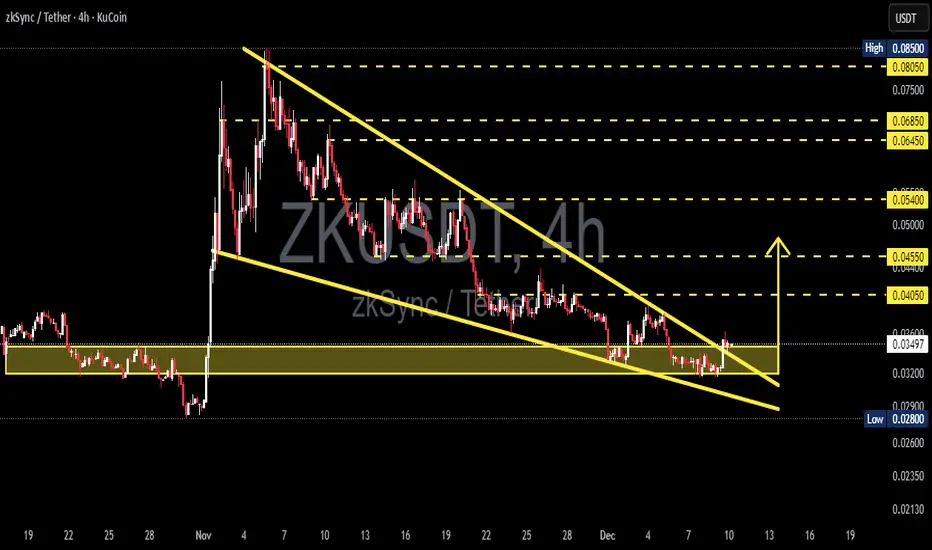
ZK/USDT - Falling Wedge – Breakout or Breakdown Ahead?ZK/USDT is entering a critical phase after a prolonged decline since early November. Price is now holding right above the 0.0347–0.0320 demand zone, the same area that previously triggered a strong bullish reaction. At the same time, sellers have been compressing price into a falling wedge structure, a pattern that historically carries a high probability of triggering major trend reversals.
This narrowing wedge signals that volatility is being compressed to its maximum point. The tighter the structure becomes, the stronger the potential breakout. If buyers manage to break above the upper wedge trendline, ZK may release weeks of accumulated bearish pressure and shift into a new bullish phase.
But this demand zone is also the bulls’ final line of defense. A clean breakdown below 0.0320 would invalidate the structure and open the door for deeper downside toward previous lows.
---
Bullish Scenario (High Probability Reversal if Confirmed)
Bullish confirmation checklist:
1. A strong 4H candle closes above the upper wedge.
2. A successful retest of the trendline as new support.
3. Increased volume on the breakout (momentum confirmation).
If confirmed, ZK’s upside potential opens toward:
Target 1: 0.0405
Target 2: 0.0455
Target 3: 0.0540
Major extension: 0.0645 – 0.0685
This structure often appears just before mid-trend to major reversals.
---
Bearish Scenario (Trend Continuation if Support Fails)
Bearish confirmation checklist:
1. Price rejects the upper wedge and loses upward momentum.
2. A decisive 4H close below 0.0320.
3. Retest of 0.0320 acting as new resistance.
Downside targets if breakdown occurs:
Target 1: 0.0280
Target 2: 0.021–0.023 if bearish momentum accelerates.
A breakdown at this zone would re-establish a deeper bearish structure with new lower lows.
---
Why This Zone Matters
1. The 0.0347–0.0320 demand zone has acted as a strong accumulation area before.
2. Falling wedges are often used by smart money as a transition pattern from distribution to accumulation.
3. Extended consolidation at support usually precedes large directional moves.
4. Low-volume dips into demand often indicate the final phase before reversal.
This makes the current price zone not just a support level, but a decision point for the next major trend.
#ZKSync #ZKUSDT #CryptoAnalysis #PriceAction #FallingWedge #DemandZone #BreakoutSetup #CryptoTrading #AltcoinAnalysis
#ZK/USDT - Don't waste this opportunity!#ZK
The price is moving in a descending channel on the 1-hour timeframe. It has reached the lower boundary and is heading towards breaking above it, with a retest of the upper boundary expected.
We have a downtrend on the RSI indicator, which has reached near the lower boundary, and an upward rebound is expected.
There is a key support zone in green at 0.03466. The price has bounced from this level multiple times and is expected to bounce again.
We have a trend towards consolidation above the 100-period moving average, as we are moving close to it, which supports the upward movement.
Entry price: 0.03580
First target: 0.03640
Second target: 0.03720
Third target: 0.03830
Don't forget a simple principle: money management.
Place your stop-loss order below the support zone in green.
For any questions, please leave a comment.
Thank you.

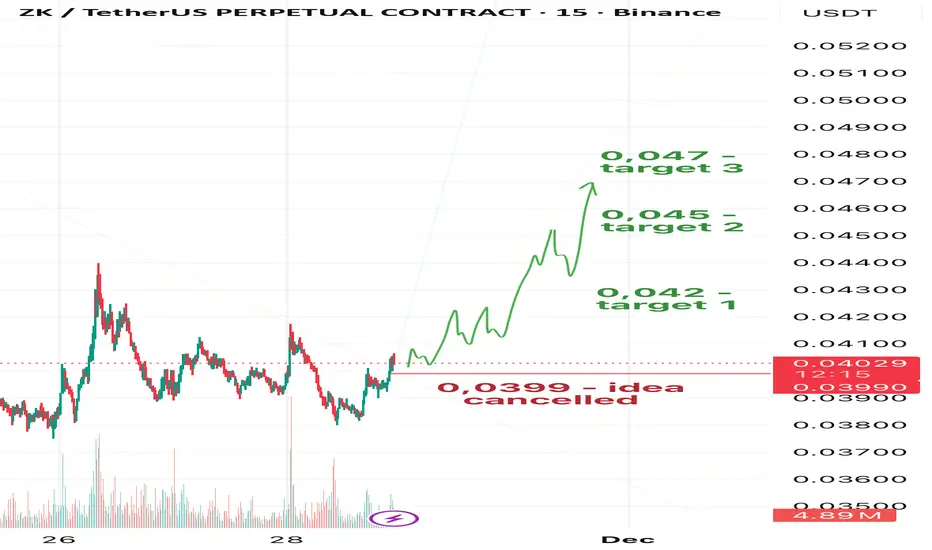
ZK: The Calm Before the ImpulseDespite the fact that the invalidation zones from my previous ZK idea were breached, the long setup didn’t break at all — it simply completed its final missing piece.
ZK is now shaping up for something big.
It really feels like the spring is getting tighter and about to snap upward.
🎯From the current price, my targets remain the same:
Target 1: 0.042
Target 2: 0.045
Target 3: 0.047
⚡️Risk/Reward:
• To T1 (0.042): ~2.6R
• To T2 (0.045): ~7.6R
• To T3 (0.047): ~11R
❌My idea gets cancelled only if price drops to 0.0399.
Until then, the structure looks clean, momentum is building, and an impulsive move seems close. 🚀
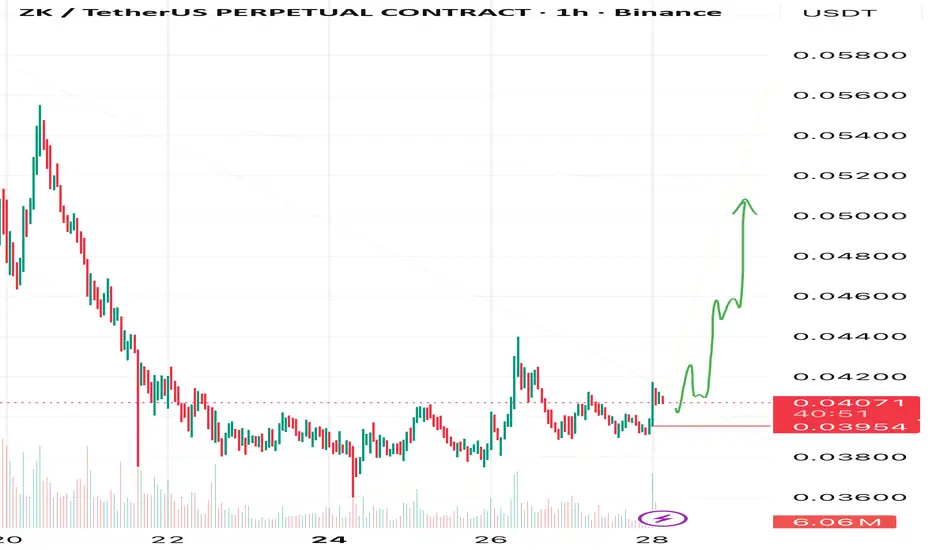
ZK – THE SPRING IS FULLY COMPRESSED!Something extremely juicy is forming on ZK right now…
After weeks of tight consolidation, the chart looks like a loaded spring that’s literally begging to get released. All the classic signs of an upcoming pump are here. One strong candle and boom — we’re off!
My upside targets:
🎯 Target 1 — 0.0420
🎯 Target 2 — 0.0440
🎯 Target 3 — 0.0470
🎯 Extended target — 0.0510 (if momentum stays crazy)
❌Invalidation (whole idea cancelled): daily close below 0.03954
Risk is tight, reward is massive. Watching this one like a hawk!
Who’s ready for the ZK moonshot? Drop a 🚀 below and follow for real-time updates!
#ZK/USDT - Don't waste this opportunity!#ZK
The price is moving in a descending channel on the 1-hour timeframe. It has reached the lower boundary and is heading towards breaking above it, with a retest of the upper boundary expected.
We have a downtrend on the RSI indicator, which has reached near the lower boundary, and an upward rebound is expected.
There is a key support zone in green at 0.03800. The price has bounced from this level multiple times and is expected to bounce again.
We have a trend towards consolidation above the 100-period moving average, as we are moving close to it, which supports the upward movement.
Entry price: 0.0900
First target: 0.04077
Second target: 0.04253
Third target: 0.04425
Don't forget a simple principle: money management.
Place your stop-loss order below the support zone in green.
For any questions, please leave a comment.
Thank you.

#ZK/USDT - Don't waste this opportunity!#ZK
The price is moving within an ascending channel on the 1-hour timeframe and is holding well. It is poised to break out strongly and retest the channel.
We have a downtrend line on the RSI indicator that is about to break and retest, which supports the upward move.
There is a key support zone in green at 0.03760, representing a strong support point.
We have a trend of consolidation above the 100-period moving average.
Entry price: 0.03890
First target: 0.04025
Second target: 0.04211
Third target: 0.04442
Don't forget a simple money management rule:
Place your stop-loss order below the green support zone.
Once you reach the first target, save some money and then change your stop-loss order to an entry order.
For any questions, please leave a comment.
Thank you.

#ZK/USDT - Don't waste this opportunity!#ZK
The price is moving in a descending channel on the 1-hour timeframe and is expected to break out and continue upwards.
We have a trend to stabilize above the 100-period moving average again.
We have a downtrend on the RSI indicator, which supports an upward move if it breaks above it.
We have a key support zone in green that pushed the price higher at 0.04550.
Entry price: 0.04630
First target: 0.04765
Second target: 0.04901
Third target: 0.05019
For risk management, don't forget your stop-loss and money management.
The stop-loss is below the support zone in green.
Upon reaching the first target, take some profits and then change your stop-loss order to an entry order.
For any questions, please comment.
Thank you.

ZK/USDT — Potential Pump Incoming?In my view, ZK looks ready for a possible pump 📈🌱
🎯 Targets:
• 1 target: 0.055
• 2 target: 0.058
• Extended potential: 0.062+
❌ Invalidation zone: 0.05199
⚠️ Disclaimer:
This is not financial advice. Please make your own decisions according to your own trading rules, and never trade without stop-losses.
🚀If you find my ideas helpful, please leave a reaction and write a comment — your support really matters to me. Without it, I honestly lose the motivation to share my forecasts

ZK - Short-Term Setup, Long-Term Vision!📈 ZK has recently shown strong momentum but is now entering a short-term correction phase after facing resistance around the blue zone.
In the immediate term, I’ll be looking for short-term long opportunities near the red structure zone, which aligns with a strong support area and potential buyer interest.
🏹From a broader perspective, the real bullish confirmation will come once price breaks and holds above the blue resistance zone. That’s where long-term buyers are expected to step in, paving the way for a sustained bullish trend.
⚔️For now, short-term traders can play the bounce, while long-term investors should keep an eye on that breakout for a possible trend shift.
⚠️ Disclaimer: This is not financial advice. Always do your own research and manage risk properly.
📊All Strategies Are Good; If Managed Properly!
~Richard Nasr

#ZK/USDT - Don't waste this opportunity!#ZK
The price is moving within an ascending channel on the 1-hour timeframe and is adhering to it well. It is poised to break out strongly and retest the channel.
We have a downtrend line on the RSI indicator that is about to break and retest, which supports the upward move.
There is a key support zone in green at 0.04970, representing a strong support point.
We have a trend of consolidation above the 100-period moving average.
Entry price: 0.05645
First target: 0.05930
Second target: 0.06255
Third target: 0.06732
Don't forget a simple money management rule:
Place your stop-loss order below the green support zone.
Once you reach the first target, save some money and then change your stop-loss order to an entry order.
For any questions, please leave a comment.
Thank you.

Following my previous outlook: ZK = bullish BIG BREAKOUT INCOMING ON NYSE:ZK ??? 🚀
Am I sniping every chart?? 🎯 Likely YES!
NYSE:ZK --> From 0.850$ to 0.650$ ✅
Following my plan: Demand zone & retest hit!✅
I enter in position here! 📈
0.100$ Next??
I know that My charts looks perfect again, but always #DYOR before investing !
ZKUSDT - A long upward journey is about to beginWe literally caught the bottom in the previous analysis — no doubt about it.
The chart looks extremely bullish and is showing massive upward momentum.
There’s a huge falling wedge pattern that has broken out and been successfully retested on the daily timeframe, with a potential target of 5x from here.
Best Regards:
Ceciliones🎯

ZK - bullish breakout! NYSE:ZK - bullish breakout above precedent high ✅📈
40 - 50% pump incoming?? 🚀🤑
Hype remain strong & uptrend clean! 📈
Prices might fly toward upper key levels:
0.100 - 0.1180 - 0.140$ - 0.1550$ (weekly).🎯

ZK - TP4 HIT IN SHORT! WHATS NEXT?? NYSE:ZK TP4 hit almost in my short position 🔥📉
Following my plan, I'll take a long entry around 0.0450 - 0.04600$!
Bull reaction can be expect here!
Not financial advice. #DYOR

Breaking: ZKsync ($ZK) Spike Almost 60% Watch This Next Levels ZKsync ( NYSE:ZK ) ZKsync a blockchain powering the next generation of builders with limitless scale. Secured by math and designed for native interoperability saw a noteworthy uptick of 56% in the past 24 hours.
This move was primarily due to Vitalik Buterin's endorsement of ZKsync.
Vitalik Buterin praised ZKsync's contributions to Ethereum after the Atlas upgrade, highlighting technical innovations that enhanced scalability. His endorsement sparked significant token interest, coinciding with institutional attention to ZKsync's ecosystem role.
As of the time of writing, the asset is up 24% amidst bullish sentiment. With the RSI at 59, there is more room for the asset to climb to new resistance point.
However, in the case of a reversal, these fibonacci levels should be watched;
38.2% Fib level
50% Fib level
61.8% fib level
ZKsync Price Data
The ZKsync price today is $0.062094 USD with a 24-hour trading volume of $900,092,732 USD. ZKsync is up 56.81% in the last 24 hours. The current CoinMarketCap ranking is #106, with a market cap of $508,077,055 USD. It has a circulating supply of 8,182,339,815 ZK coins and a max. supply of 21,000,000,000 ZK coins.

ZKUSDT - Don't waste this opportunity!Did you know that ZK dropped more than 98.5% from its peak in December 2024 until October 10, 2025?
If you can’t imagine what that means, let me explain:
Coins that experience such a massive drop usually get delisted and die off—they rarely recover.
But ZK surged over 1,300% from its October 10 bottom in less than 23 days and is now about to break a major resistance at the 0.618 Fibonacci level.
And I want to point out something:
ZEC and ZK sound similar, and even their letters resemble each other—definitely a hint at the market makers’ codes.
Best Regards:
Ceciliones🎯

#ZK/USDT#ZK
The price is moving in a descending channel on the 1-hour frame and is adhering to it well and is heading to break it upwards strongly and retest it
We have a bounce from the lower limit of the descending channel, this support is at a price of 0.0676
We have a downtrend on the RSI indicator that is about to break and retest, which supports the rise
We have a trend to stabilize above the moving average 100
Entry price 0.0729
First target 0.0792
Second target 0.0838
Third target 0.0896

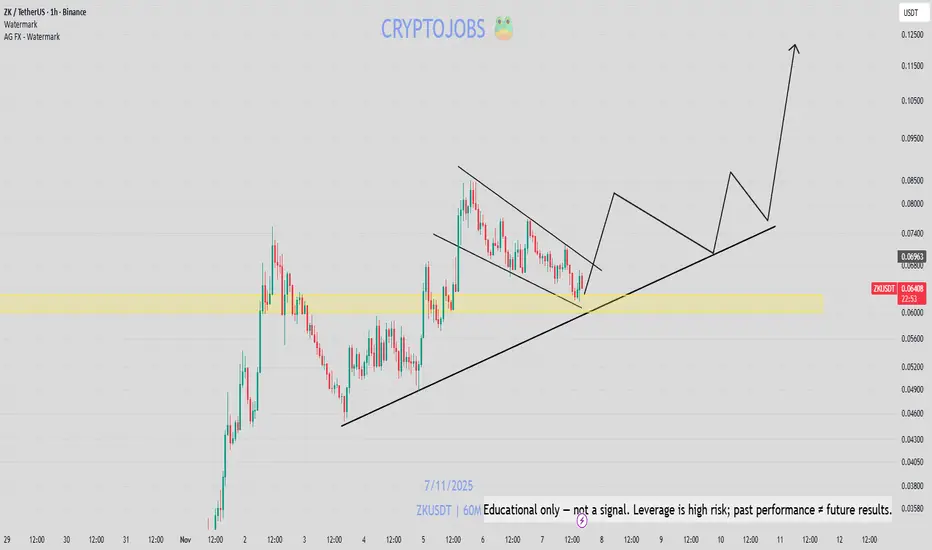
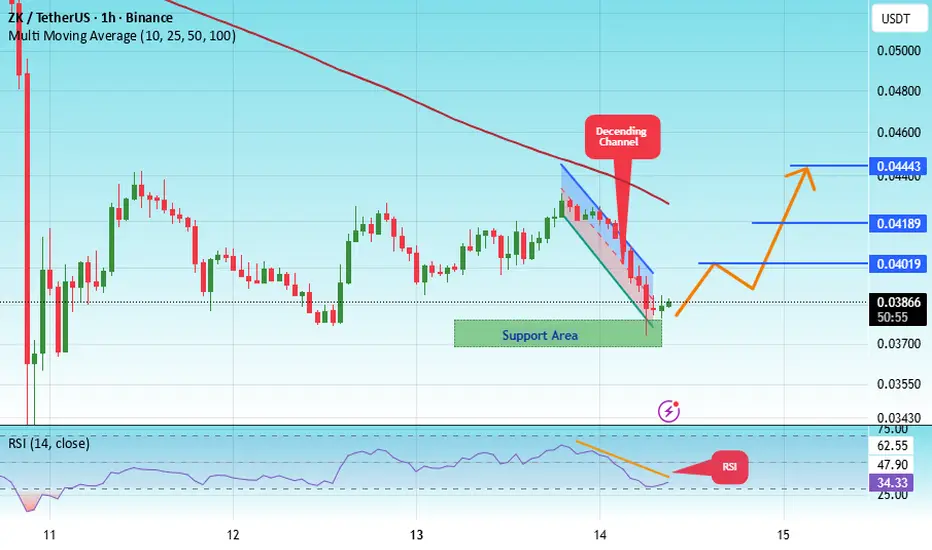
#ZK/USDT — Descending Triangle Key Support, Breakout or Breakd#ZK
The price is moving within a descending channel on the 1-hour frame, adhering well to it, and is heading for a strong breakout and retest.
We have a bearish trend on the RSI indicator that is about to be broken and retested, which supports the upward breakout.
There is a major support area in green at 0.03736, which represents a strong support point.
We are heading for consolidation above the 100 moving average.
Entry price: 0.03853
First target: 0.04019
Second target: 0.04189
Third target: 0.004443
Don't forget a simple matter: capital management.
When you reach the first target, save some money and then change your stop-loss order to an entry order.
For inquiries, please leave a comment.
Thank you.
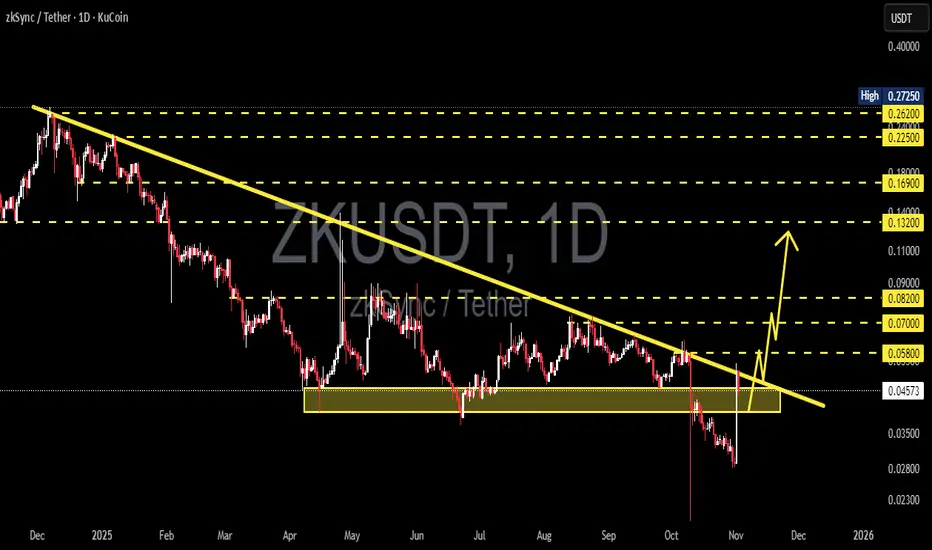
ZKSync (ZK) — Decision Point: Breakout or Breakdown?The ZKUSDT (Daily) pair has reached a critical juncture that will decide its next major move. Since early 2025, price action has been trapped below a descending trendline, acting as a dominant wall of selling pressure. Every breakout attempt has been rejected, reaffirming bearish control.
Now, the price is sitting right at the crossroads — between the descending trendline above and a key accumulation/support zone at 0.0465–0.040 (yellow block) below.
This zone isn’t just another range — it’s the battleground that will determine whether ZKSync is preparing for a major reversal or about to continue its downtrend into new lows.
---
Pattern & Structure:
Formation of a Descending Triangle with a flat horizontal base (0.0465–0.040) and a falling trendline resistance.
The structure shows persistent selling pressure, but every dip into the lower zone attracts strong buying reactions — a clear tug-of-war between bulls and bears.
A recent liquidity grab (false breakout wick) signals stop-hunting activity, often a precursor to a major move.
The market is coiling tightly — volatility compression suggests a large expansion phase is near.
---
Bullish Scenario: “Reversal Confirmed”
If ZK successfully closes and holds above the descending trendline with strong momentum and volume, it could mark the start of a new medium-term uptrend.
Key confirmation:
Daily close above 0.048–0.050
Successful retest of the trendline as new support
Upside targets:
1. 0.058 — first resistance and structural pivot
2. 0.070 — confirmation of trend reversal
3. 0.082 → 0.132 — extended bullish targets if momentum continues
Rationale:
Breaking a descending triangle to the upside often triggers a short squeeze as traders exit bearish positions, accelerating price movement and initiating a shift in market structure.
---
Bearish Scenario: “Final Breakdown”
If ZK fails to hold its ground and closes daily below 0.040, the descending triangle pattern would confirm as a bearish continuation, signaling further downside.
Key confirmation:
Strong daily close below 0.040
Failed retest from below (support turned resistance)
Downside targets:
1. 0.028 — previous local low
2. 0.023 — potential capitulation zone
Rationale:
Losing this base indicates buyers have fully lost control. Historically, such breakdowns lead to sharp selloffs as short-term holders exit rapidly, increasing momentum on the downside.
---
Conclusion:
> ZKSync is sitting at a make-or-break level — a zone that will define the next directional wave.
Bullish case: breakout above trendline → targets 0.058–0.070.
Bearish case: breakdown below 0.040 → targets 0.028–0.023.
Expect a major volatility expansion once this compression phase resolves.
---
Trading Strategy & Risk Notes:
Wait for daily candle confirmation, not just wicks — avoid getting trapped in fakeouts.
Conservative entry: after breakout + retest.
Aggressive entry: near support with clear rejection confirmation.
Stop-loss: below 0.040 (for longs) or above 0.0465 (for shorts).
Maintain a risk/reward ratio of at least 1:2 and scale out profits at each target level.
---
Key Technical Levels:
Support zone: 0.0465 – 0.040
Trendline resistance: ~0.048–0.050
Upside levels: 0.058 → 0.070 → 0.082 → 0.132
Downside targets: 0.028 → 0.023
#ZKUSDT #ZKSync #CryptoAnalysis #DescendingTriangle #BreakoutTrading #SupportResistance #CryptoBreakout #ChartAnalysis #PriceAction #CryptoTrader #ReversalZone #BearishOrBullish
ZKUSDT — Descending Triangle Key Support, Breakout or Breakdown?Full Analysis
On the 2-day timeframe, ZKUSDT is forming a very clear descending triangle pattern:
Downtrend line (yellow) shows sellers’ dominance with consecutive lower highs.
Horizontal support zone (yellow box 0.0366 – 0.0531) is still being defended multiple times, showing that buyers are not giving up.
Price is now moving near the triangle apex, meaning a major decision point is approaching soon.
📉 Traditionally, descending triangles lean bearish, but in crypto markets, bullish fakeouts often happen when buyers step in strongly around critical demand zones.
---
Pattern and Market Dynamics
1. Volatility Compression: Price range is narrowing, volume decreasing — a build-up phase before an explosive move.
2. Buyer Defense: The 0.0366 – 0.0531 support zone has become a crucial demand area. Each dip has been absorbed by buyers.
3. Seller Pressure: Meanwhile, sellers consistently push price lower, creating the descending trendline.
4. Apex Zone: The convergence of trendline and support will decide the next major direction.
---
Bullish Scenario
If price closes a 2D candle above the descending trendline with strong volume, then:
Immediate upside targets:
0.0653 (minor resistance)
0.0800 (psychological level & supply zone)
0.0943 (strong resistance)
Extended targets:
0.1094 → if the altcoin market recovers further
0.1451 → confirmation of a medium-term reversal
From the current level, upside potential could reach +170% if the bullish scenario fully plays out.
---
Bearish Scenario
If price closes below the support box (0.0366 – 0.0531) and confirms with selling volume, then:
Initial target: 0.0366 (recent low)
Next target: around 0.0200 (psychological zone)
Extreme case: down to 0.0100 if panic selling occurs
From current levels, downside risk could be as deep as −80% in a worst-case breakdown scenario.
---
Pattern Conclusion
Descending Triangle = Neutral–Bearish bias, but no breakout yet.
Price is entering the “last squeeze” phase — the market is about to decide direction in the coming weeks.
Breakout or breakdown with volume will be the ultimate confirmation.
---
Strategy & Risk Management
Conservative traders: Wait for breakout/breakdown confirmation on the 2D close, enter on the retest with a tight stop-loss.
Aggressive traders: Can start accumulating near support with SL below 0.0366, targeting 0.0653–0.0800.
Reminder: Fakeouts are common in descending triangles — do not over-leverage without confirmation.
---
ZKSync (ZKUSDT, 2D) is standing at a major crossroad. A descending triangle is nearing its apex, with sellers pressing down and buyers defending the key 0.0366 – 0.0531 support.
Bullish case: breakout above trendline → targets 0.0653 – 0.1451
Bearish case: breakdown below support → targets 0.0366 down to 0.0200 or even 0.0100
🚨 The next move will decide: is ZK ready for a major rally, or a deeper fall?
Watch the 2D close + volume for confirmation.
#ZKSync #ZKUSDT #CryptoAnalysis #Altcoins #DescendingTriangle #CryptoBreakout #SupportResistance
