ZOOM (ZM)| Approaching The Buying Area!Hi,
The price of the well-known video communication software ZOOM has started to approach quite a solid buying area, at least from a short-term perspective.
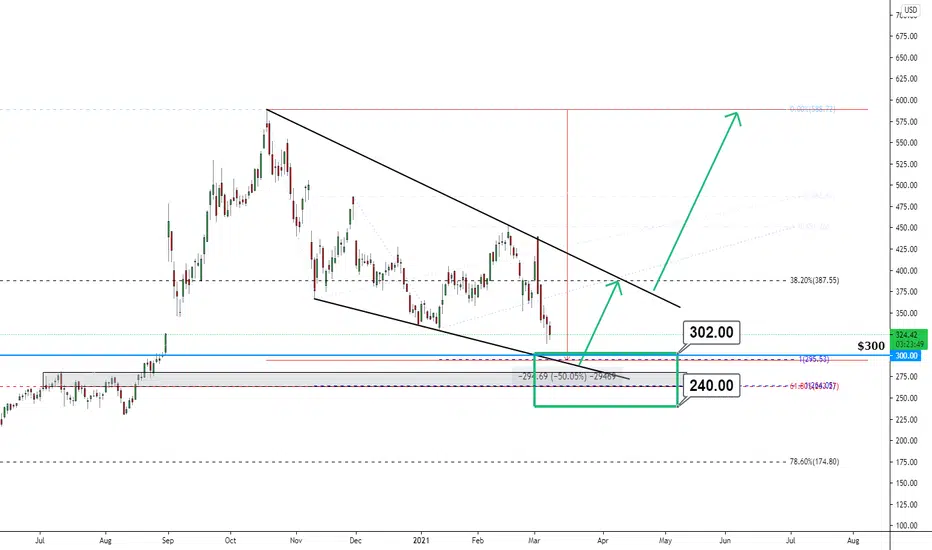
Long story short, technically, the good buying area stays between $240 to $302 and the criteria are:
1) $300 the mid-round number acting as a support
2) Small resistance level in 2020 become support
3) 2x Equal Waves ending points are in the marked green buying box to add strength in there
4) 50% fall from the ATH (all-time high)
5) Minor lower trendline third touch
6) Fibo retracement 62%
These are the major criteria for this current rejection area, do your own fundamental research and if this matches with my technical analysis then you are ready to go.
The first target stays around $400 ~30-40%
The second one will be the current ATH ~100%
Stay healthy,
Vaido
ZOOM
Zoom - key support - in 3Dthe very idea of an interest rate above zero, at some point in the future, sends NAS into a spin. Market bear flag...

EW Analysis: ZOOM Is Looking For A Deeper CorrectionHello traders and investors!
Today we will talk about Zoom, its price action from a technical point of view and wave structure from Elliott Wave perspective.
Zoom made a massive rise in 2020 as it was and it's still very useful app for video communications.
However, nothing goes in straight lines, so we see it as a completed wave 3 and since October 2020, we can see Zoom trading in a bigger, higher degree a-b-c corrective decline within wave 4, which seems to be unfinished after recent sideways price action and corrective wave structure, ideally a running triangle pattern within wave "b".
Well, with current strong decline, it looks like wave "c" is now in progress that can push the price even down to 280 - 230 support zone before we may see a bullish continuation back to highs within wave 5.
All the best!
If you like what we do, the please like and share the idea.
Disclosure: Please be informed that information we provide is NOT a trading recommendation or investment advice. All of our work is for educational purposes only.


ZOOM- Bull Flag! 🐂After rising tremendous rates during the pandemic, Zoom got into a Cool-Down period.
Now that the bull flag was completed it is set again for a good rise!
Fundamentals:
Income statement: 2018-2019 --> +298.43% increase
2019-2020 --> +233.66% increase
Cash Flow: 2018 -2019 --> +164.24% increase
2019-2020 --> +195.90% increase
Big investors are keeping a HOLD opinion on this boy, while the street seems to catch-up on the Bull Flag.
Entry Point: In the short/Mid-term with the currently completed bull-flag we are keeping a BUY on Zoom. Long-term definitely a buy as well.
Also, the earnings are coming up next month on 03/01/2021 which will add some volume to the stock as well!

ZM/Zoom RISKY areaAs you can see ZM is in a risky criteria at the moment but I believe if it breaks the FIB RET 0.382, it can climb to around 500$

Zoom Video Communications Is BullishIf the pattern is confirmed to be an expanded flat then we will see the price head to $588 in the coming days. There is also a possibility of price breaking the last low at point c first before heading north, that's how this pattern sometimes behaves. Don't miss this. Like and share this chart with all your friends so they can benefit from this analysis. Thank you.

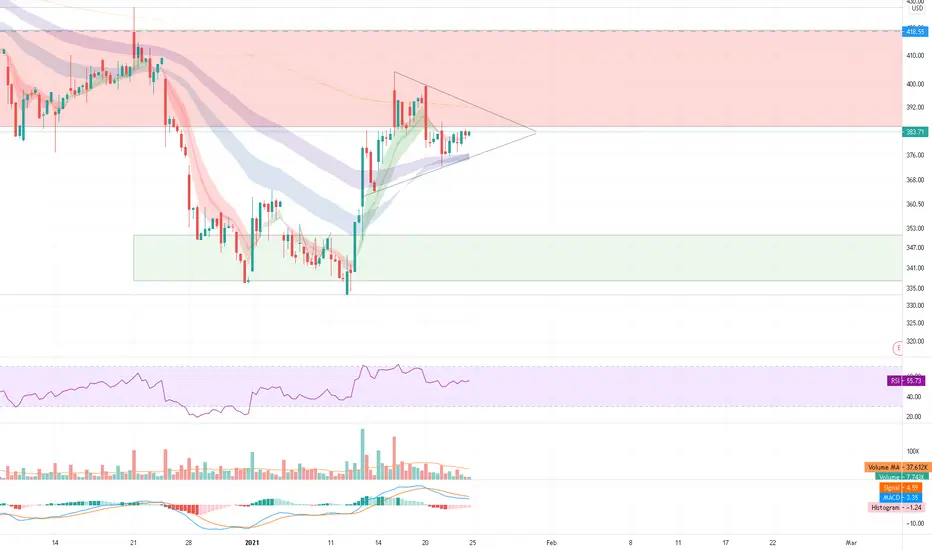
$ZM/Zoom Wedge brokenWe see a demand base at $345-$280 blocking the price to drop as a result of the falling wedge caused by the Q3-4 transition.
After the stock jumps above the wedge (breaking the trend, see red circle), we see it respecting & hovering around the 382 support established and respected at the following dates (10th December '20, 16th November '20, 10th November '20, 10th September '20, and the 11th September '20) - the price adjusts above and below the support, before starting to push upwards - showing that it *is* being used as a support and not a resistance level.
I can see the stock reaching (at least) the dotted blue line as it was used as a resistance in September and December '20 but was also used as a support back in late September and early October '20.


Long due to descending triangle and small inverse H&S pattern. Long due to descending triangle and small inverse H&S pattern.
Target and Sl and R:R mentioned on chart

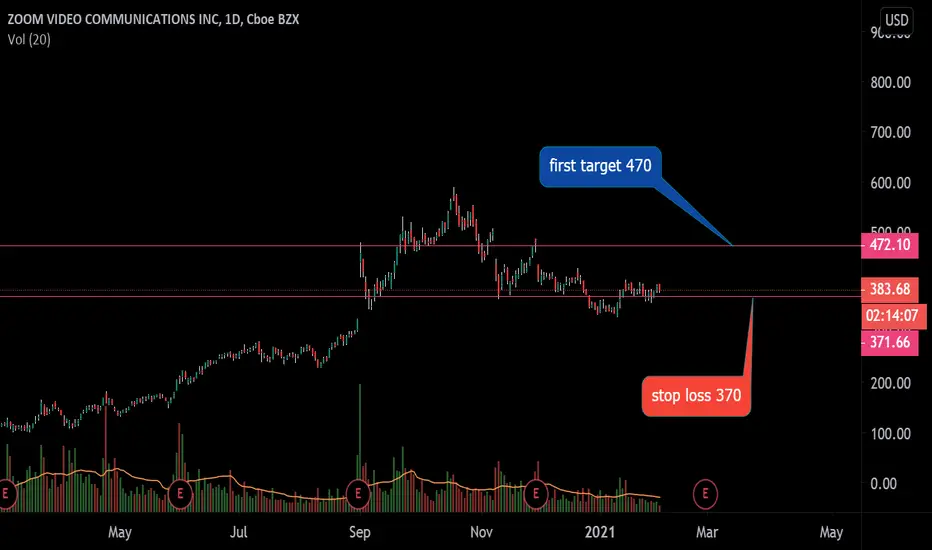
Zoom: Reversal at $400Zoom is already knocking on the door of $400 psychological.
Even though we have been going down pretty steep & wedgy and gave back 40% from the tops, Zoom managed to maintain the 50% Fibo Levels from the bull move up:
A break above $400 higher would lead to a more sideways consolidation from the ATH, instead of steep continuation. We can expect to run towards the upper $400 range to towads $500, so definitely a 20% profit potential from current levels.

ZOOM - The Most Detailed Video Analysis!Hello everyone, if you like the idea, do not forget to support with a like and follow.
Here is the top-down analysis for ZOOM, feel free to request any pair/instrument or ask any questions in the comment section below.
Best of luck!

BlackBerry still a Buy?On Dec. 1, Blackberry announced it had partnered with Amazon Web Services to develop and bring to market BlackBerry's Intelligent Vehicle Data Platform, IVY. Automakers will be able to use the software for the smart and autonomous electric vehicles being developed.
On Oct. 16, Blackberry announced it was partnering with Zoom. Zoom will be using Blackberry’s Blackberry Dynamics cybersecurity software in its mobile platform to protect companies from cyberattacks and data breaches. Blackberry Dynamics software also provides secure video conferencing, which Blackberry says will become more necessary as companies move away from in-person meetings.
Earlier this month, it was reported that Blackberry had sold 90 patents to Chinese telecommunications company Huawei. (Source: benzinga.com)
Please leave me a message if you want to test the buy and sell indicators that i am using.

ZM symmetrical triangle This is two hour ZM chart with supply/demand zones
Please do your own charting im new trader.
If you have some tips feel free to leave them in comments thank you.
$ZM struggling with fib retracement. Inverted C&H?Hello fellow traders and padawans. I did a previous analysis on ZM where I suggested it formed a rounded top (links below). Zoom reacted from the rounded top neckline and rallied a few percentage points. It is struggling with the first fib retracement level for the third consecutive day, which I have anticipated on the previous analyses (seriously, check them out). It looks now that is forming an inverted cup and handle, which is a common pattern to be formed after a rounded top. Bulkowski even suggests them as "related patterns" on his book.
Anyway, keep this on your radar. If the pattern is confirmed there may be way more downside for zoom. Also, there may be smaller patterns within the inverted C&H. Remember: large patterns tend to win most of the times.
Safe trades!
Share the love:
If you get anything out of this TA, please like the chart so it moves up and others can benefit from my work. A simple click on the like button goes a long ways.
Follow for more:
I have an outstanding winning rate (check my other charts). If you want the best entry/exits just follow me, you won't regret. Thanks a lot!
***The ideas shared here are my opinion, not financial advise to place trades. Please do your own research before buying/selling stocks***


$zm - falling wedge, bullish divergencefaked out on the breakout from friday. this week should bring bigger moves with this bullish divergence + falling wedge.


$ZM Zoom Ready For BreakThe combination of a downward wedge and strong resistance and support levels indicates Zoom will break through the top resistance and take off. Price target: $431.08

ZOOOOM recovery before earnings callAs i suspect the 1.5BUSD deal to go through, i suspect rappid price increase before the earnigs
No target price comes to my mind.
Disclosure: have some long position in ZM


ZM completing WXY correction?I think Zoom is close with its long WXY correction. Resistances at $375 and $410. Rumors with S&P 500 inclusion would be the catalyst to reverse the current downtrend. Zoom almost filled the ER gap back in September. Relative volume today was high leading to signs that a impulsive wave may be ready.
