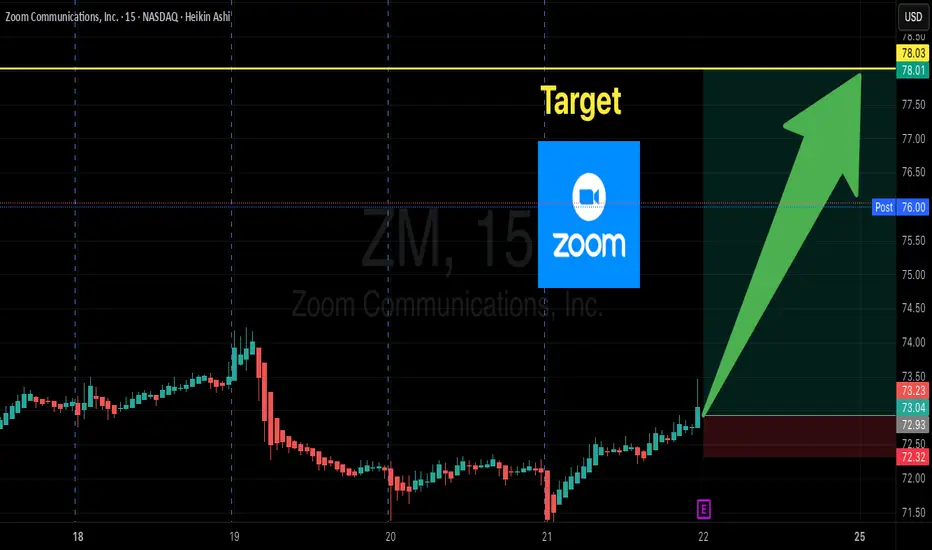
Zoom $78 Calls: Huge Earnings Upside Potential!
## 🚀 Zoom Earnings Play: Cheap Calls Before the Bell (Aug 21, 2025) 🚀
### 🏦 Earnings Outlook
* 📊 **Revenue Growth:** +2.9% TTM – stagnant post-COVID growth
* ⚖️ **Margins:** Gross 75.9%, Profit 22.3% → Strong efficiency
* 📈 **Historical Beat Rate:** 100% over last 8 quarters
* 🖥️ **Sector:** Tech / SaaS – AI and cloud trends impact growth sentiment
* 🧭 **Analyst Consensus:** Buy, with upside potential
---
### 🔎 Options Flow Insight
* 📉 **Put Activity:** OTM puts (\$66-\$67) highlight cautious institutional sentiment
* ⚖️ **Put/Call Skew:** Slightly bearish, hedging activity present
* 💡 **Opportunity:** Take advantage of earnings momentum with \$78 calls
---
### 📉 Technical Setup
* 📊 **Current Price:** \$72.16 → below 50D (\$75.09) & 200D (\$78.61) MA
* 🔑 **Support:** \$71.00
* 🔑 **Resistance:** \$75–\$78
* 💥 Volume: Slightly below average, indicates muted momentum
---
### 🎯 Trade Setup (Earnings Play)
* 🟢 **Direction:** CALL (Bullish Bias)
* 🎯 **Strike:** \$78.00
* 💵 **Entry Price:** \$0.98
* 📅 **Expiry:** Aug 22, 2025
* 📊 **Size:** 1 contract
* 🕒 **Entry Timing:** Pre-earnings close
📌 **Profit Target:** \$2.94 (200% 🚀)
📌 **Stop Loss:** \$0.49 (50% of premium)
📌 **Exit Rule:** Within 2 hours post-earnings to avoid theta decay
---
🔥 Hashtags for Reach 🔥
\#ZoomEarnings #ZMOptions #EarningsPlay #TechStocks #OptionsTrading #TradingSetup #DayTrading #SwingTrading #WallStreet
Zoomvideoshort
ZM Swing Trade (Short)Noticing a rising wedge form on ZM's 4 HR Chart as well as a loss of momentum, indicated by downward movement of the MACD. Also sitting around the .236 Fib extension level. Due for a significant downward move, most likely to the 181.47 mark that I have.

ZOOM VIDEO COMMUNICATIONS INC (ZM) DailyDates in the future with the greatest probability for a price high or price low.
The Djinn Predictive Indicators are simple mathematical equations. Once an equation is given to Siri the algorithm provides the future price swing date. Djinn Indicators work on all charts, for any asset category and in all time frames. Occasionally a Djinn Predictive Indicator will miss its prediction date by one candlestick. If multiple Djinn prediction dates are missed and are plowed through by same color Henikin Ashi candles the asset is being "reset". The "reset" is complete when Henikin Ashi candles are back in sync with Djinn price high or low prediction dates.
One way the Djinn Indicator is used to enter and exit trades:
For best results trade in the direction of the trend.
The Linear Regression channel is used to determine trend direction. The Linear Regression is set at 2 -2 30.
When a green Henikin Ashi candle intersects with the linear regression upper deviation line (green line) and both indicators intersect with a Djinn prediction date a sell is triggered.
When a red Henikin Ashi candle intersects with the linear regression lower deviation line (red line) and both indicators intersect with a Djinn prediction date a buy is triggered.
This trading strategy works on daily, weekly and Monthly Djinn Predictive charts.
This is not trading advice. Trade at your own risk.
