ZONAUSDT Coin Analysis and CommentaryZONAUSDT Coin Analysis and Commentary
ZORA Coin indicators are currently in a negative condition. In the daily technical outlook, selling pressure is expected to continue. In a possible pullback, the 0.08479 support level will be monitored. If this level is broken downward, a decline toward the 21-day moving average (0.074807) may occur. If the price stabilizes around this average, it could create an opportunity for another upward move in the coming weeks. In a potential positive scenario, the 0.100768 resistance level is significant, and the price must break above it. Due to the negative indicators, our overall outlook for ZORA Coin remains bearish.
Resistance: 0,100768 - 0,119190
Support: 0,084799 - 0,73306
We’d appreciate it if you could boost our posts and share them on your social media. 🚀
Legal Disclaimer:
The information, comments, and recommendations contained herein do not constitute investment advice. Investment advisory services are provided only within the framework of an investment advisory agreement to be signed between the investor and authorized institutions such as brokerage firms, portfolio management companies, and non-deposit banks.
The opinions expressed here are personal views and may not be suitable for your financial situation, risk profile, or return preferences. Therefore, no investment decisions should be made based solely on the information and opinions presented on this page.
Zoracoin

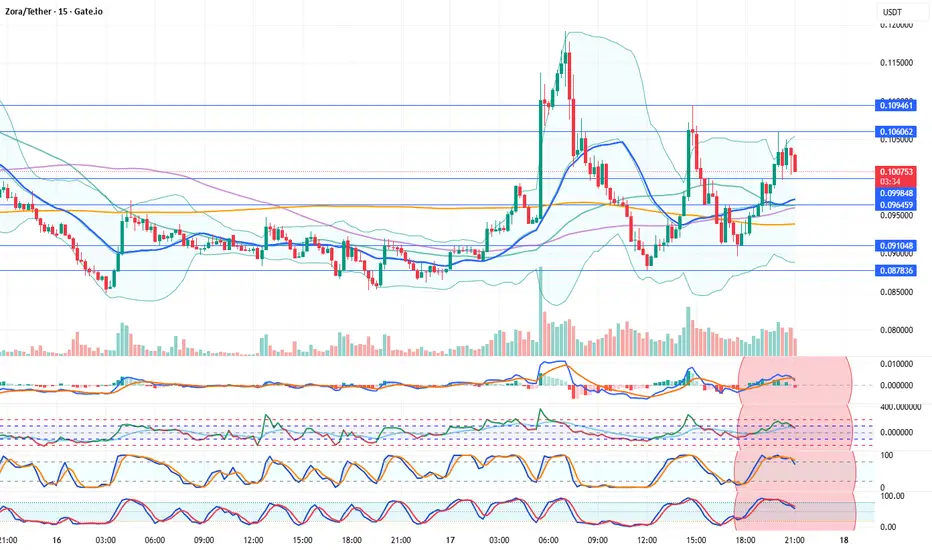
ZORAUSDT Coin Analysis and CommentaryZORAUSDT Coin Analysis and Commentary
Indicators for Zora Coin are currently negative. On the 15-minute technical chart, selling pressure is increasing. The coin has turned downward from the 0.106 resistance level, entering a negative phase. Additional selling may occur in the short term. In this situation, support levels will be closely monitored.
Resistances: 0.106062 – 0.109461
Supports: 0.099848 – 0.096459 – 0.091048 – 0.087836
We’d appreciate it if you could boost our posts and share them on your social media. 🚀
Legal Disclaimer:
The information, comments, and recommendations contained herein do not constitute investment advice. Investment advisory services are provided only within the framework of an investment advisory agreement to be signed between the investor and authorized institutions such as brokerage firms, portfolio management companies, and non-deposit banks.
The opinions expressed here are personal views and may not be suitable for your financial situation, risk profile, or return preferences. Therefore, no investment decisions should be made based solely on the information and opinions presented on this page.
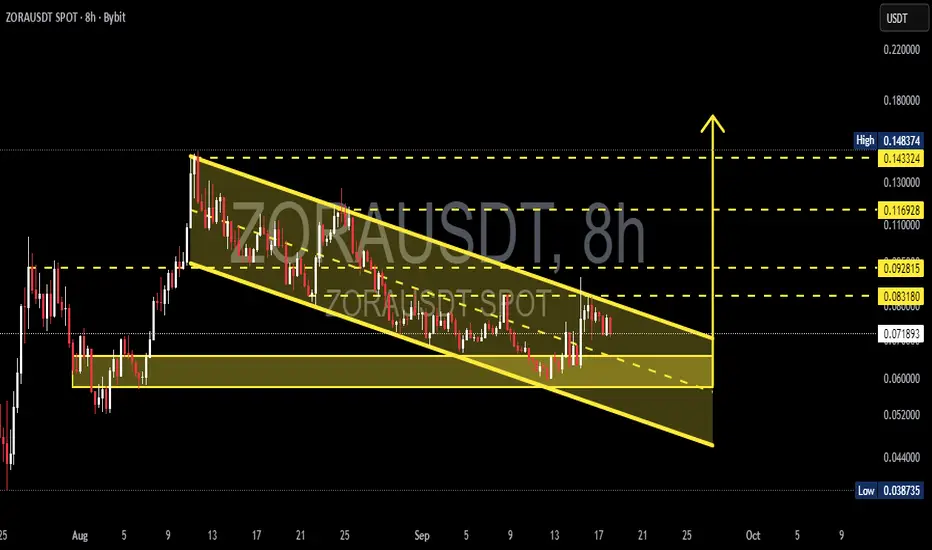
ZORA/USDT — Descending Channel Reaching Decision Point?Currently, ZORA/USDT is trading inside a well-defined descending channel, formed since the mid-August peak. The structure shows a sequence of lower highs and lower lows, reflecting mid-term bearish control. However, this pattern also resembles a falling wedge, which often signals a potential bullish reversal if a breakout occurs.
---
🔹 Technical Structure
Main Pattern: Descending channel (slightly converging, similar to a falling wedge).
Current Price: ~0.0719 USDT
Demand Zone: 0.055 – 0.062 (strong accumulation area tested multiple times).
Key Support: 0.0387 (chart low).
Resistance Levels:
0.0831 → first breakout trigger
0.0928 → next psychological resistance
0.1169 → mid-term target if momentum holds
0.1433 – 0.1483 → major resistance zone / previous rally high
---
🔹 Bullish Scenario
1. Price must close above the channel’s upper trendline and 0.0831 on the 8H timeframe.
2. A valid breakout should be confirmed with strong volume + successful retest of the upper channel as new support.
3. If confirmed, bullish targets are:
🎯 Target 1 → 0.0928
🎯 Target 2 → 0.1169
🎯 Target 3 → 0.1433 – 0.1483
📍 Note: A failed breakout (false breakout) could send price back into the channel.
---
🔹 Bearish Scenario
1. If price gets rejected at the upper channel or fails to close above 0.0831, downside pressure may return.
2. A strong breakdown below the demand zone (0.055–0.062) opens the path toward 0.0387.
3. Bearish outlook is invalidated if the price sustains above 0.0831 with confirmation.
---
🔹 Conclusion
ZORA/USDT is approaching a critical decision zone.
The descending channel structure provides two clear paths:
🚀 Bullish breakout above 0.0831 → upside targets 0.0928 – 0.1433.
📉 Breakdown below 0.055–0.062 → potential continuation toward 0.0387.
Key decision levels: 0.0831 (resistance) and 0.055–0.062 (support zone).
---
📢 Trading Notes
Always wait for 8H/1D candle close for confirmation before execution.
Risk management is crucial — never enter without a stop loss.
Descending channels often lead to explosive moves once a breakout is confirmed — be prepared.
---
ZORA/USDT is consolidating inside a descending channel. 0.0831 is the breakout trigger for a bullish reversal, while 0.055–0.062 remains the key demand zone. Breakout → targets 0.0928 – 0.1433. Breakdown → risk toward 0.0387. Watch candle close + volume for confirmation.
---
#ZORA #ZORAUSDT #Crypto #Altcoins #TechnicalAnalysis #TradingView #ChartPattern #Breakout #SupportResistance #PriceAction
Zora Long ideaa quick long on BINANCE:ZORAUSDT.P
Overall market not looking good and its risky now to take long but this is my setup . lets see how its go...

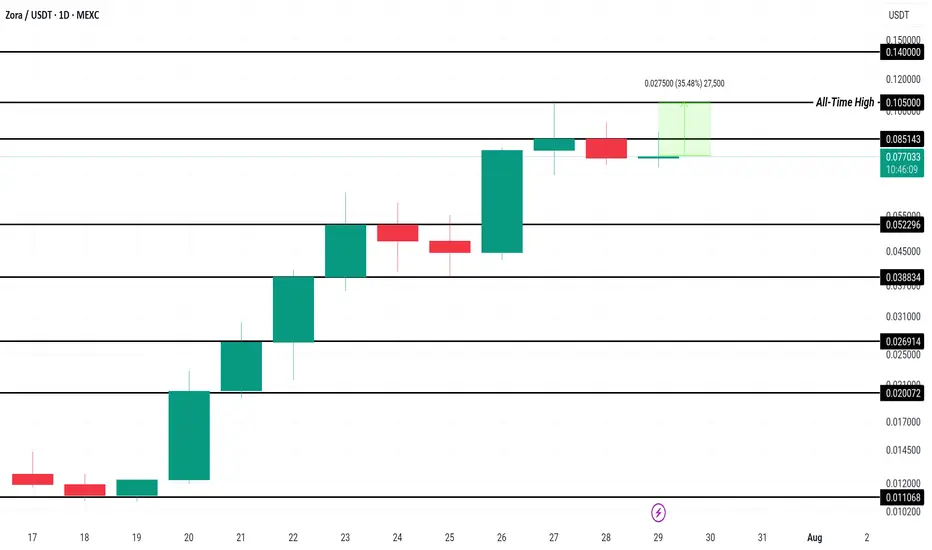
Zora Price Stands 35% From ATH; Can It Make It This Week?MEXC:ZORAUSDT has been rallying for the past ten days, recently reaching a new all-time high (ATH) of $0.105. Currently, Zora is trading at $0.775 , just below the resistance of $0.085. This recent rally has sparked optimism among investors, positioning Zora for potential further gains.
Given the altcoin’s 7% increase today, there’s a high probability that $ MEXC:ZORAUSDT will surpass its ATH of $0.105 , potentially reaching new highs beyond $0.140 this week . The strong momentum indicates that the bullish trend could continue if the current market conditions hold.
However, if investor sentiment shifts and selling pressure intensifies, MEXC:ZORAUSDT price could dip below $0.052 . A significant drop through this support level would invalidate the current bullish outlook and could signal a longer-term decline in the coin’s value.
Breaking: $ZORA Spike 200% After ListingZora, a token on the Base blockchain saw a 200% price surge hours after listing on notable crypto exchanges. The asset started trading 12 UTC with about 10B ZORA in total and Max supply the asset started trading at $0.02568.
As per data from CMC, there's about 52982.18% increase in 24 hour trading volume with an influx of $23,016,656.05.
Whether or not $ZORA performs, the asset is pretty much new without much trading data. However, all eyes are set on the $0.040 a level that is presently regarded as the all-time high. Similarly, a break below the critical support point of $0.01 which is regarded as the all time low could be diabolical for $ZORA coin.
ZORA Price Data
The ZORA price today is $0.027767 USD with a 24-hour trading volume of $16,783,314 USD. ZORA is up 7.59% in the last 24 hours. The current CoinMarketCap ranking is #3155. The circulating supply is not available and a max. supply of 10,000,000,000 ZORA coins.
