ZORA Sell/Short Setup (2H)Add this pair to your watchlist; if it reaches our entry zone, we’ll take a position
The price shows strong confirmations for a drop | the short-term trendline has been broken, and the supportive order blocks have failed.
The market has been ranging for a while, but the price seems likely to break out to the downside.
Targets, stop-loss, and entry zone are marked on the chart.
For risk management, please don't forget stop loss and capital management
When we reach the first target, save some profit and then change the stop to entry
Comment if you have any questions
Thank You
ZORAUSD

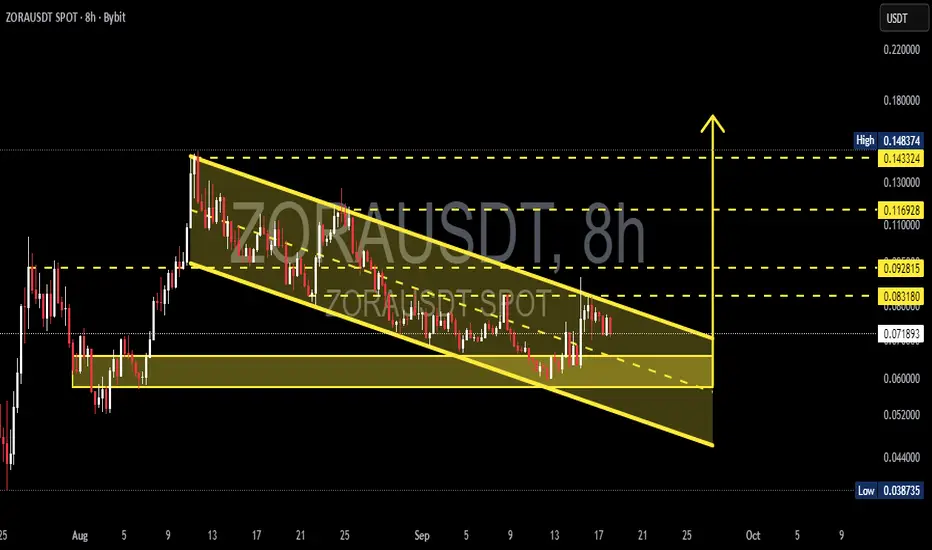
ZORA/USDT — Descending Channel Reaching Decision Point?Currently, ZORA/USDT is trading inside a well-defined descending channel, formed since the mid-August peak. The structure shows a sequence of lower highs and lower lows, reflecting mid-term bearish control. However, this pattern also resembles a falling wedge, which often signals a potential bullish reversal if a breakout occurs.
---
🔹 Technical Structure
Main Pattern: Descending channel (slightly converging, similar to a falling wedge).
Current Price: ~0.0719 USDT
Demand Zone: 0.055 – 0.062 (strong accumulation area tested multiple times).
Key Support: 0.0387 (chart low).
Resistance Levels:
0.0831 → first breakout trigger
0.0928 → next psychological resistance
0.1169 → mid-term target if momentum holds
0.1433 – 0.1483 → major resistance zone / previous rally high
---
🔹 Bullish Scenario
1. Price must close above the channel’s upper trendline and 0.0831 on the 8H timeframe.
2. A valid breakout should be confirmed with strong volume + successful retest of the upper channel as new support.
3. If confirmed, bullish targets are:
🎯 Target 1 → 0.0928
🎯 Target 2 → 0.1169
🎯 Target 3 → 0.1433 – 0.1483
📍 Note: A failed breakout (false breakout) could send price back into the channel.
---
🔹 Bearish Scenario
1. If price gets rejected at the upper channel or fails to close above 0.0831, downside pressure may return.
2. A strong breakdown below the demand zone (0.055–0.062) opens the path toward 0.0387.
3. Bearish outlook is invalidated if the price sustains above 0.0831 with confirmation.
---
🔹 Conclusion
ZORA/USDT is approaching a critical decision zone.
The descending channel structure provides two clear paths:
🚀 Bullish breakout above 0.0831 → upside targets 0.0928 – 0.1433.
📉 Breakdown below 0.055–0.062 → potential continuation toward 0.0387.
Key decision levels: 0.0831 (resistance) and 0.055–0.062 (support zone).
---
📢 Trading Notes
Always wait for 8H/1D candle close for confirmation before execution.
Risk management is crucial — never enter without a stop loss.
Descending channels often lead to explosive moves once a breakout is confirmed — be prepared.
---
ZORA/USDT is consolidating inside a descending channel. 0.0831 is the breakout trigger for a bullish reversal, while 0.055–0.062 remains the key demand zone. Breakout → targets 0.0928 – 0.1433. Breakdown → risk toward 0.0387. Watch candle close + volume for confirmation.
---
#ZORA #ZORAUSDT #Crypto #Altcoins #TechnicalAnalysis #TradingView #ChartPattern #Breakout #SupportResistance #PriceAction
Zora Long ideaa quick long on BINANCE:ZORAUSDT.P
Overall market not looking good and its risky now to take long but this is my setup . lets see how its go...

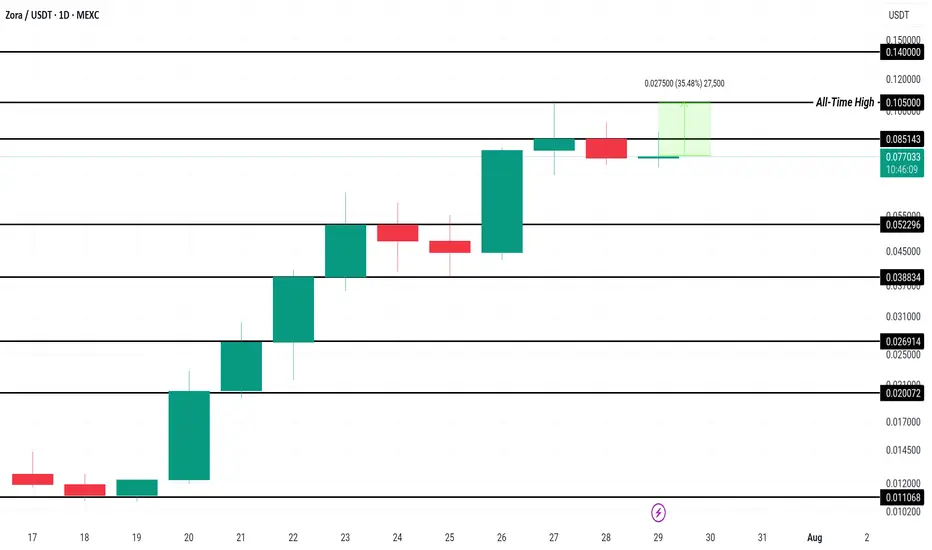
Zora Price Stands 35% From ATH; Can It Make It This Week?MEXC:ZORAUSDT has been rallying for the past ten days, recently reaching a new all-time high (ATH) of $0.105. Currently, Zora is trading at $0.775 , just below the resistance of $0.085. This recent rally has sparked optimism among investors, positioning Zora for potential further gains.
Given the altcoin’s 7% increase today, there’s a high probability that $ MEXC:ZORAUSDT will surpass its ATH of $0.105 , potentially reaching new highs beyond $0.140 this week . The strong momentum indicates that the bullish trend could continue if the current market conditions hold.
However, if investor sentiment shifts and selling pressure intensifies, MEXC:ZORAUSDT price could dip below $0.052 . A significant drop through this support level would invalidate the current bullish outlook and could signal a longer-term decline in the coin’s value.