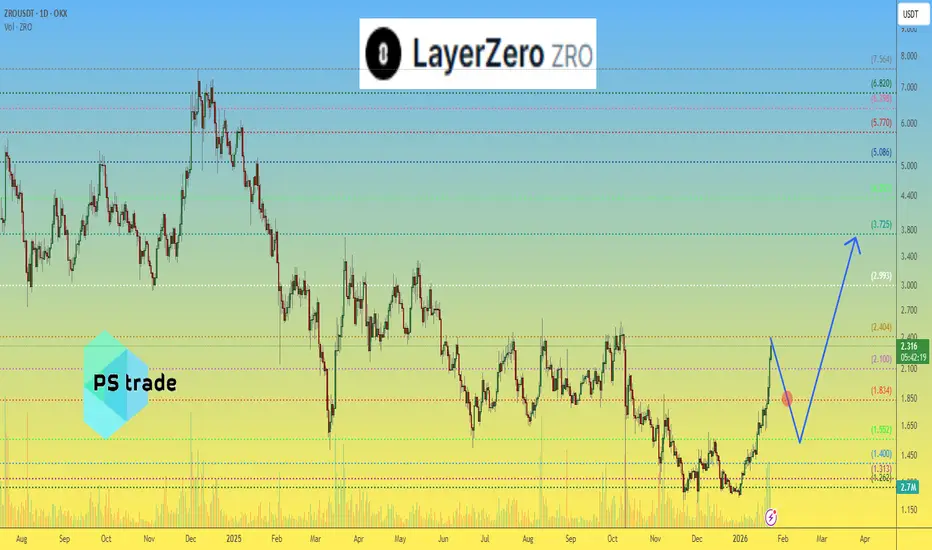
LayerZero ZRO price analysis#ZRO traders — stay sharp here
OKX:ZROUSDT is approaching a major resistance zone at $2.40–2.50 — a level the market has failed to reclaim for almost 6 months.
After such a strong, almost vertical move with no real pullback, the probability of a clean breakout on the first attempt looks rather low.
🔄 A correction to “reload momentum” would be healthy:
optimistic scenario → $1.80
bearish scenario → $1.55
From these zones, #ZRO could build a solid base for:
➡️ another push toward $2.40
➡️ continuation to $3.00
➡️ and potentially $3.70
❓ Do you expect a pullback before the breakout, or will #ZRO surprise this time
______________
◆ Follow us ❤️ for daily crypto insights & updates!
🚀 Don’t miss out on important market moves
🧠 DYOR | This is not financial advice, just thinking out loud
ZRO
ZRO Breaking Structure | Bullish Continuation Setup (4H)From the point where the red arrow is placed on the chart, the corrective phase for ZRO has begun.
Based on the current price structure, this correction appears to be forming a triangle pattern, and price action suggests that we are now developing wave D of this triangle. This indicates that the correction is still ongoing but may be approaching its later stages.
In addition, a short-term descending trendline has been broken to the upside, which is an early bullish signal and supports the idea of a potential continuation move after the correction is completed.
Therefore, on a pullback toward the highlighted green support zone, as well as a retest of the broken trendline, we can look for buy/long opportunities, provided that bullish price action and confirmation signals appear.
The short-term targets are clearly marked on the chart and can be used for partial profit-taking or risk management.
⚠️ Invalidation:
This analysis will be invalidated if a daily candle closes below the invalidation level marked on the chart. In that case, the current bullish scenario would no longer be valid, and the market structure should be reassessed.
If you have a coin or altcoin you want analyzed, first hit the like button and then comment its name so I can review it for you.
This is not a trade setup, as it has no precise stop-loss, stop, or target. I do not publish my trade setups here.

ZRO/USDT — Imperfect Bullish Wedge: Conditional Long SetupOn the higher timeframe, a large bullish wedge has formed.
However, it’s not a clean structure:
• there was a downside sweep during the October drop,
• in recent weeks, three additional sweeps occurred, each followed by a return inside the pattern.
The wedge can be considered partially weakened, but that does not rule out a reversal from current levels.
Longs can be considered as long as price does not close below 1.7$,
or alternatively after a confirmed breakout above the wedge’s upper boundary.
For a medium-term outlook, the asset becomes attractive only after a sustained break and hold above 2.6$.

#ZRO/USDT could be another strong contender#ZRO
The price is moving within a descending channel on the hourly timeframe. It has reached the lower boundary and is heading towards a breakout, with a retest of the upper boundary expected.
The Relative Strength Index (RSI) is showing a downward trend, approaching the lower boundary, and an upward bounce is anticipated.
There is a key support zone in green at 1.66, and the price has bounced from this level several times. Another bounce is expected.
The indicator is showing a trend towards consolidation above the 100-period moving average, which we are approaching, supporting the upward move.
Entry Price: 1.70
First Target: 1.73
Second Target: 1.78
Third Target: 1.84
Stop Loss: Below the green support zone.
Remember this simple thing: Money management.
For any questions, please leave a comment.
Thank you.

ZRO Sell/Short Signal (4H)📉 Bearish Market Structure Breakdown | Trendline Loss & Supply Zone Pullback Analysis
The price has recently lost a major trendline that had been respected for a long period of time and was acting as a key support to maintain the bullish trend. While the market was trading above this trendline, buyers were in control and the overall structure remained bullish. However, the recent breakdown below this level signals a potential shift in market sentiment.
In addition, a clear bearish Change of Character (CHoCH) has formed on the chart, indicating that sellers are starting to take control. Following this structure shift, the market has continued to print lower lows and lower highs (ZRO), which confirms the transition into a bearish market structure.
Currently, price action appears to be making a pullback toward the broken trendline and the nearby supply zone, which is a common behavior after a breakout. This area can now act as a strong resistance zone and may provide high-probability selling opportunities if bearish confirmation appears.
📌 Trade Entry Strategy:
Traders are advised to wait for a proper entry trigger, such as bearish candlestick patterns, lower timeframe structure breaks, or strong rejection from the supply zone. Entering only at confirmed and reliable levels can help improve risk-to-reward ratios and reduce unnecessary losses.
🎯 Targets & Risk Management:
All potential take-profit targets have been clearly marked on the chart based on previous support levels and market structure. Proper risk management is essential, and stop-loss placement should always be respected.
⚠️ Invalidation Level:
If a daily candle closes above the invalidation level, this bearish scenario will be invalidated. Such a move would indicate renewed bullish strength and may suggest a possible trend reversal.
📊 Conclusion:
This setup highlights a potential bearish continuation based on trendline breakdown, market structure shift, and pullback into supply. Traders should remain patient, wait for confirmation, and follow their trading plan carefully.
If you would like us to analyze a coin or altcoin for you, first like this post, then comment the name of your altcoin below.

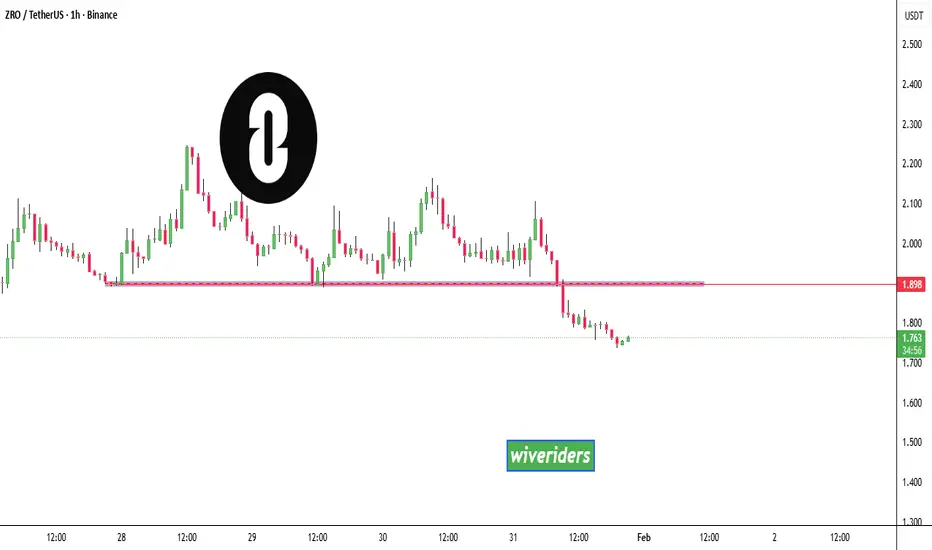
ZRO Update🚨📊 ZRO Update
Price has formed a new red resistance zone 🔴.
Until price breaks above this zone,
selling pressure may remain in control.
This level is key to watch ,
waiting for confirmation.
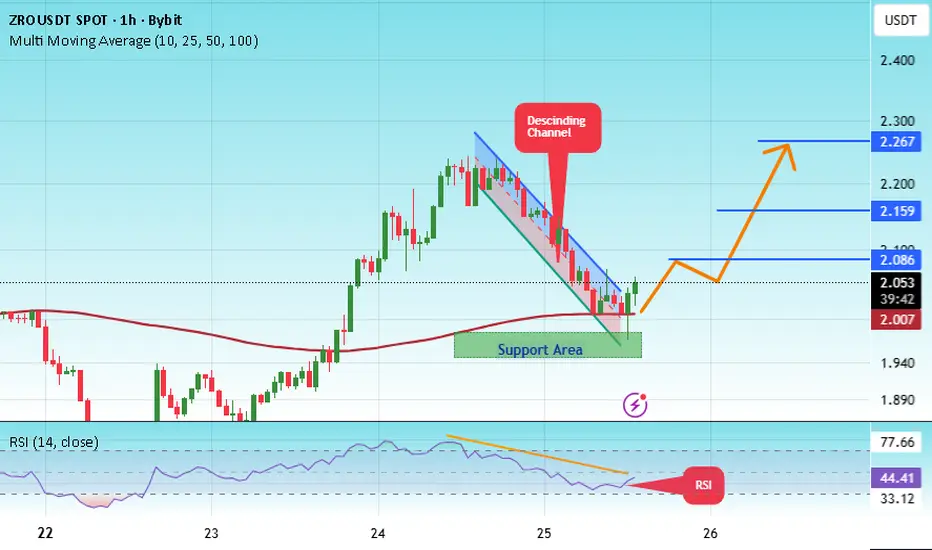
#ZRO/USDT could be another strong contender#ZRO
The price is moving within a descending channel on the hourly timeframe. It has reached the lower boundary and is heading towards a breakout, with a retest of the upper boundary expected.
The Relative Strength Index (RSI) is showing a downward trend, approaching the lower boundary, and an upward bounce is anticipated.
There is a key support zone in green at 1.87, and the price has bounced from this level several times. Another bounce is expected.
The RSI is showing a trend towards consolidation above the 100-period moving average, which we are approaching, supporting the upward move.
Entry Price: 1.94
First Target: 2.003
Second Target: 2.08
Third Target: 2.16
Stop Loss: Below the green support zone.
Remember this simple thing: Money management.
For any questions, please leave a comment.
Thank you.

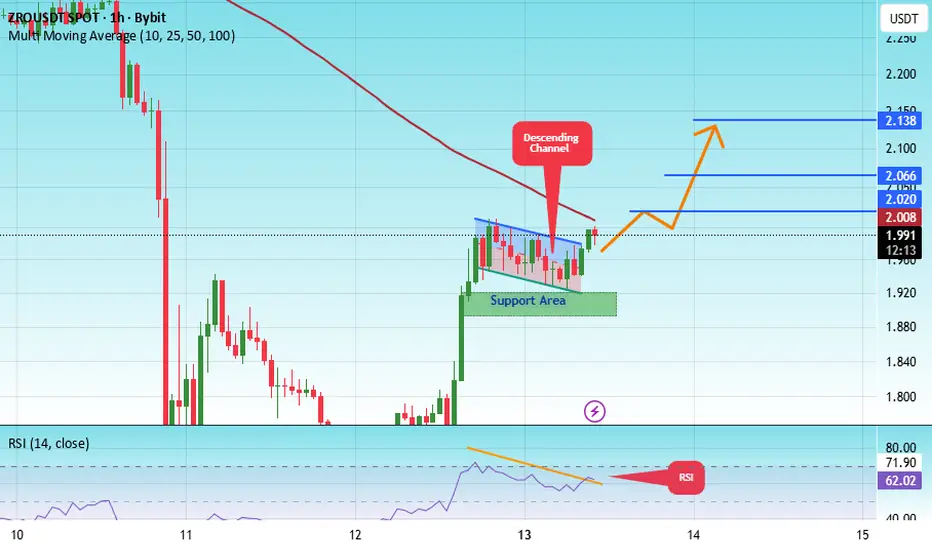
#ZRO/USDT Reversal Potential Breakout & Fibonacci Retest in Fo#ZRO
The price is moving within a descending channel on the 1-hour frame, adhering well to it, and is heading for a strong breakout and retest.
We have a bearish trend on the RSI indicator that is about to be broken and retested, which supports the upward breakout.
There is a major support area in green at 1.90, representing a strong support point.
We are heading for consolidation above the 100 moving average.
Entry price: 1.99
First target: 2.00
Second target: 2.06
Third target: 2.13
Don't forget a simple matter: capital management.
When you reach the first target, save some money and then change your stop-loss order to an entry order.
For inquiries, please leave a comment.
Thank you.
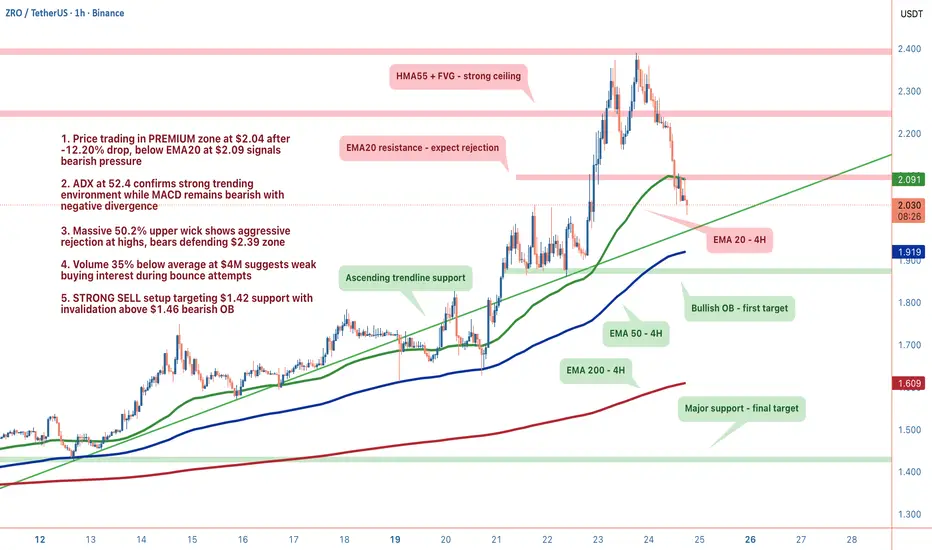
ZROUSDT: Premium Zone RejectionZRO delivered a textbook premium zone rejection with a -12.20% drop to $2.04. That 50.2% upper wick tells the story, bulls attempted a push, got obliterated, and now we're trading below EMA20 at $2.09. When you're in premium territory and getting rejected this violently, the probability matrix tilts bearish.
1. THE TECHNICAL REALITY 📉
• Price sitting at $2.04 in premium zone, firmly below EMA20 ($2.09)
• ADX at 52.4 confirms strong trending environment, not choppy range conditions
• 50.2% upper wick shows aggressive rejection at $2.39, bears defending structure
• Volume 35% below average at $4M signals weak buying conviction on bounce attempts
2. THE INDICATORS ⚖️
Bearish Signals:
• MACD bearish with negative momentum (0.0937 vs 0.1149 signal)
• RSI at 53.8 shows room to fall before capitulation levels
• Below-average volume indicates no smart money accumulation
Bullish Signals:
• Swing structure remains technically bullish (BOS bullish signal present)
• Ascending support trendline from $1.21 at $1.73 with 67 touches
The Conflict:
We have bullish swing structure but we're trading in premium. Premium is where you sell in uptrends, the structural context suggests distribution, not accumulation.
3. THE TRADE SETUP 🎯
🔴 Scenario A: Premium Continuation (Primary)
• Trigger: Rejection holds below $2.09 EMA20
• Entry: Current levels around $2.04
• Target 1: $1.87 (bullish OB, scale out)
• Target 2: $1.42 (major support, final target)
• Stop: Above $1.46 (bearish OB invalidation)
• R:R: Approximately 2.5:1 with proper scaling
🟢 Scenario B: Structure Shift
• Trigger: 4H close above $1.46 bearish order block
• Invalidation: Compromises bearish thesis entirely
• Reassessment Zone: $1.73 ascending trendline (67 touches)
MY VERDICT
The probability matrix favors bears at 72% confidence. Premium rejection + strong trend + weak volume creates a favorable risk-reward environment for continuation. Path of least resistance points down until structure proves otherwise.
ZRO/USDT at a Critical Zone — Falling Wedge Trigger a Reversal?ZRO/USDT on the 3D timeframe is still trading within a medium-term downtrend, however selling pressure is gradually weakening. Price is currently moving near a major support zone while forming a tightening price structure. From a technical perspective, this condition opens the possibility for a trend reversal or relief rally, provided a valid breakout occurs.
---
Pattern & Price Structure
A Falling Wedge pattern is clearly formed, characterized by:
Descending lower highs with decreasing slope
Lower lows converging into a narrowing range
This pattern is considered a bullish reversal pattern once price breaks above the upper resistance line.
Price is now approaching the apex of the wedge, a zone where directional expansion commonly occurs.
---
Key Levels
Support:
1.30 – 1.35 (lower wedge support / main demand zone)
A breakdown below this area may trigger further downside continuation
Resistance:
1.80 (minor resistance & upper wedge trendline)
2.40 (strong resistance / previous reaction level)
3.00 (key psychological resistance)
5.00 (major resistance & supply zone)
6.75 – 7.56 (previous high / major distribution area)
---
Bullish Scenario
Price successfully breaks and closes above the Falling Wedge resistance
Ideal confirmation: a 3D candle close above 1.80
Potential upside targets:
2.40
3.00
5.00
Bullish momentum will strengthen if supported by increasing volume
Market structure shifts from lower highs to higher highs
Bullish Conclusion:
A confirmed breakout from the Falling Wedge may signal the beginning of a medium-term trend reversal.
---
Bearish Scenario
Price fails to break resistance and gets rejected near the upper wedge
A valid breakdown occurs if a 3D candle closes below 1.30
Potential downside targets:
1.05
0.85
Bearish structure remains intact with continued lower highs and lower lows
Bearish Conclusion:
As long as price remains below wedge resistance, downtrend continuation risk remains present.
---
Final Conclusion
ZRO/USDT is trading at a critical decision zone. The Falling Wedge formation suggests an early reversal signal, but confirmation through a valid breakout is essential. Traders are advised to wait for candle close confirmation before making decisions.
#ZROUSDT #ZRO #CryptoAnalysis #Altcoin #FallingWedge #BullishReversal #BearishScenario #TechnicalAnalysis #CryptoTrading

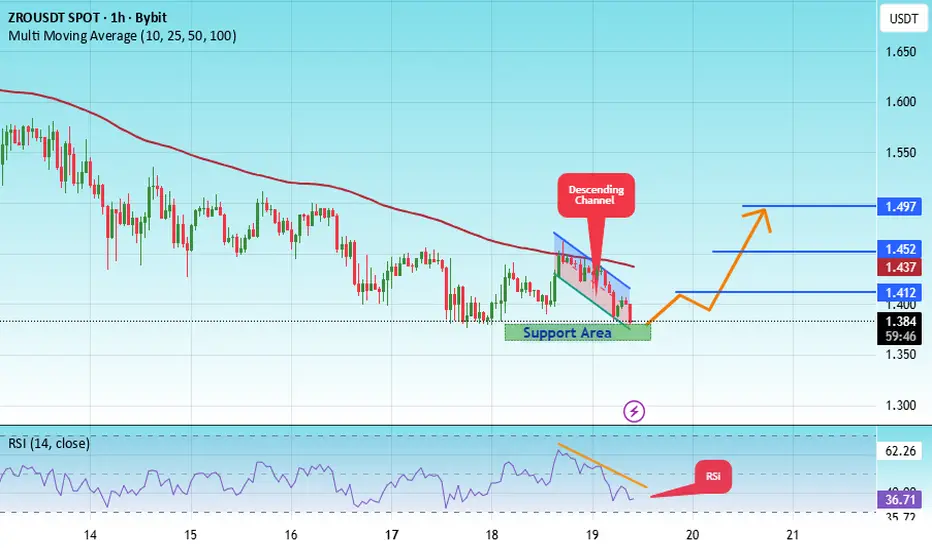
#ZRO/USDT could be another strong contender#ZRO
The price is moving in a descending channel on the 1-hour timeframe. It has reached the lower boundary and is heading towards a breakout, with a retest of the upper boundary expected.
We are seeing a bearish bias in the Relative Strength Index (RSI), which has reached near the lower boundary, and an upward bounce is expected.
There is a key support zone in green at 1.39, and the price has bounced from this level several times. Another bounce is expected.
We are seeing a trend towards stabilizing above the 100-period moving average, which we are approaching, supporting the upward trend.
Entry Price: 1.41
First Target: 1.45
Second Target: 1.48
Third Target: 1.53
Remember a simple principle: Money Management.
Place your stop-loss order below the green support zone.
For any questions, please leave a comment.
Thank you.

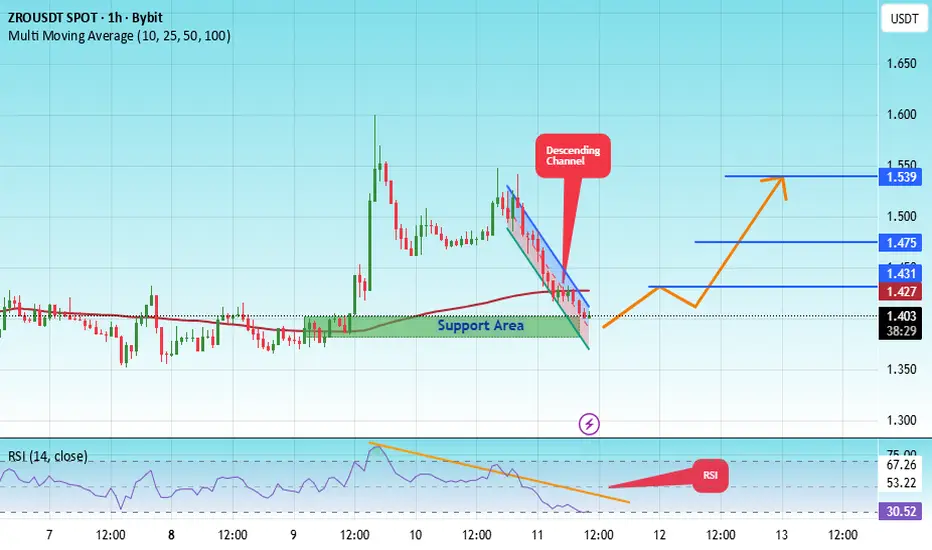
#ZRO/USDT could be another strong contender#ZRO
The price is moving in a descending channel on the 1-hour timeframe. It has reached the lower boundary and is heading towards breaking above it, with a retest of the upper boundary expected.
We have a downtrend on the RSI indicator, which has reached near the lower boundary, and an upward rebound is expected.
There is a key support zone in green at 1.24. The price has bounced from this zone multiple times and is expected to bounce again.
We have a trend towards consolidation above the 100-period moving average, as we are moving close to it, which supports the upward movement.
Entry price: 1.26
First target: 1.28
Second target: 1.32
Third target: 1.36
Don't forget a simple principle: money management.
Place your stop-loss below the support zone in green.
For any questions, please leave a comment.
Thank you.

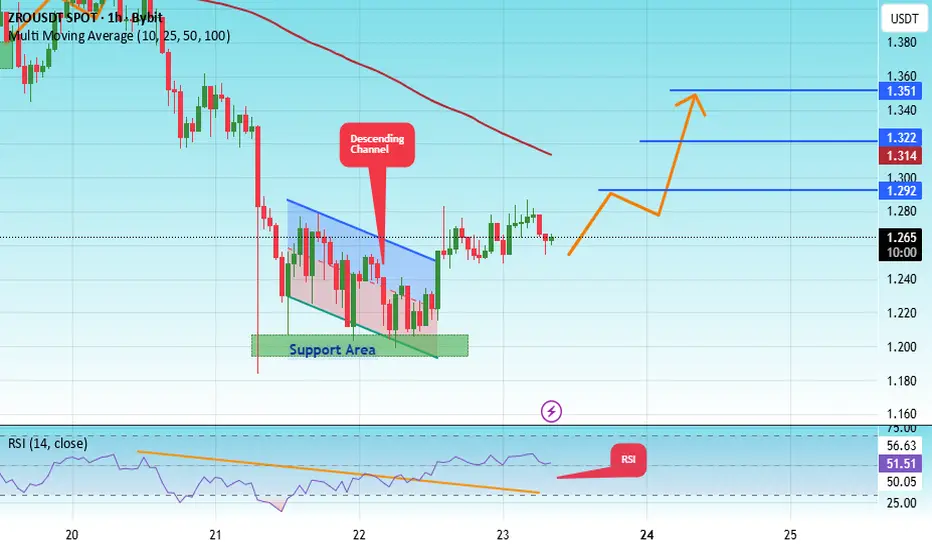
#ZRO/USDT could be another strong contender
#ZRO
The price is moving in a descending channel on the 1-hour timeframe. It has reached the lower boundary and is heading towards breaking above it, with a retest of the upper boundary expected.
We have a downtrend on the RSI indicator, which has reached near the lower boundary, and an upward rebound is expected.
There is a key support zone in green at 1.33. The price has bounced from this zone multiple times and is expected to bounce again.
We have a trend towards consolidation above the 100-period moving average, as we are moving close to it, which supports the upward movement.
Entry price: 1.40
First target: 1.43
Second target: 1.47
Third target: 1.54
Don't forget a simple principle: money management.
Place your stop-loss below the support zone in green.
For any questions, please leave a comment.
Thank you.
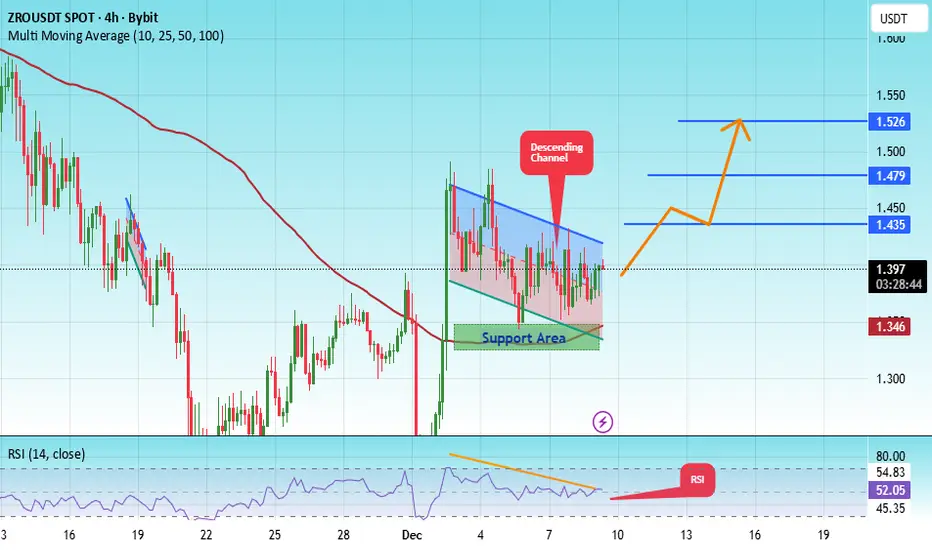
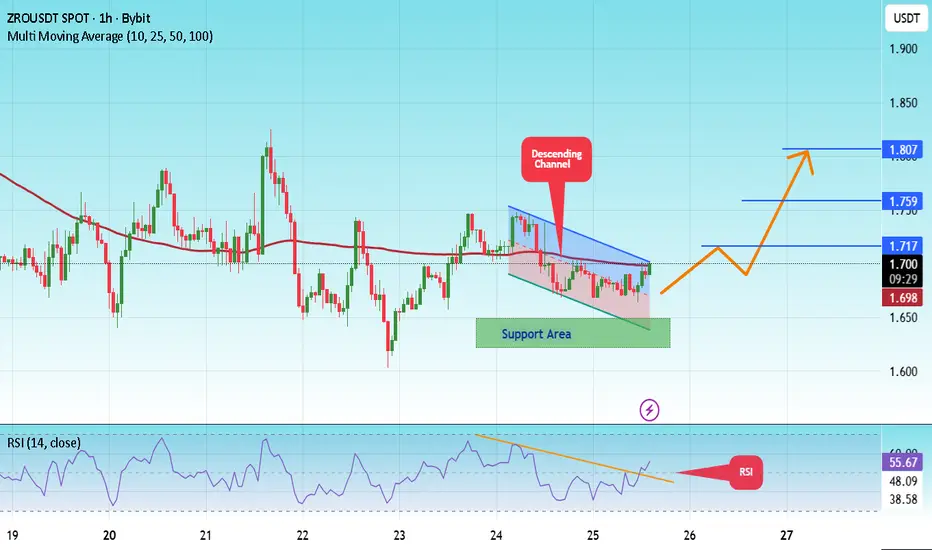
#ZRO/USDT could be another strong contender#ZRO
The price is moving in a descending channel on the 1-hour timeframe. It has reached the lower boundary and is heading towards breaking above it, with a retest of the upper boundary expected.
We have a downtrend on the RSI indicator, which has reached near the lower boundary, and an upward rebound is expected.
There is a key support zone in green at 1.33. The price has bounced from this zone multiple times and is expected to bounce again.
We have a trend towards stability above the 100-period moving average, as we are moving close to it, which supports the upward movement.
Entry price: 1.40
First target: 1.43
Second target: 1.48
Third target: 1.53
Don't forget a simple principle: money management.
Place your stop-loss below the green support zone.
For any questions, please leave a comment.
Thank you.
#ZRO/USDT could be another strong contender#ZRO
The price is moving within an ascending channel on the 1-hour timeframe and is adhering to it well. It is poised to break out strongly and retest the channel.
We have a downtrend line on the RSI indicator that is about to break and retest, which supports the upward move.
There is a key support zone in green at the 1.20 price, representing a strong support point.
We have a trend of consolidation above the 100-period moving average.
Entry price: 1.26
First target: 1.29
Second target: 1.32
Third target: 1.35
Don't forget a simple money management rule:
Place your stop-loss order below the green support zone.
Once you reach the first target, save some money and then change your stop-loss order to an entry order.
For any questions, please leave a comment.
Thank you.
#ZRO/USDT could be another strong contender#ZRO
The price is moving within an ascending channel on the 1-hour timeframe and is adhering to it well. It is poised to break out strongly and retest the channel.
We have a downtrend line on the RSI indicator that is about to break and retest, which supports the upward move.
There is a key support zone in green at the price of 1.36, representing a strong support point.
We have a trend to stabilize above the 100-period moving average.
Entry price: 1.38
First target: 1.41
Second target: 1.50
Third target: 1.50
Don't forget a simple money management rule:
Place your stop-loss order below the support zone in green.
Once you reach the first target, save some money and then change your stop-loss order to an entry order.
For any questions, please leave a comment.
Thank you.
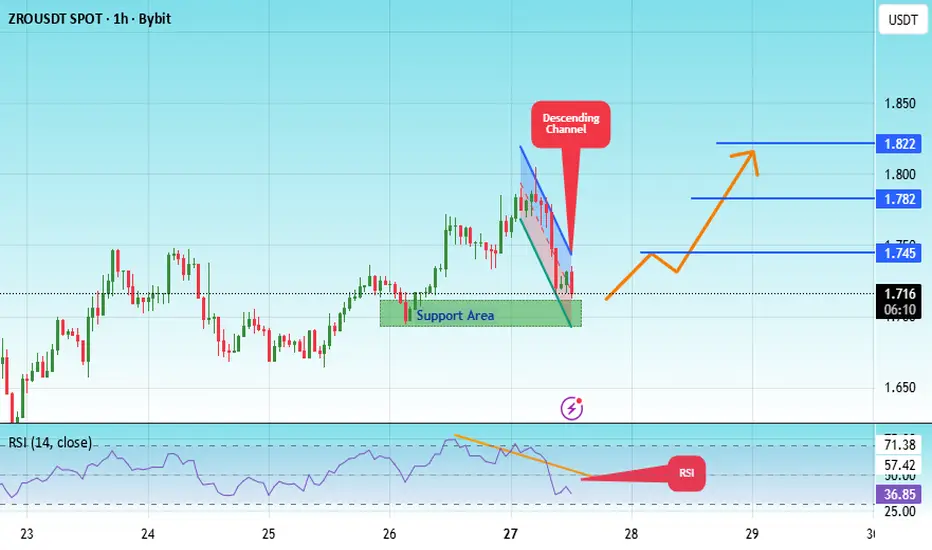
#ZRO/USDT could be another strong contender #ZRO
The price is moving in an ascending channel on the 1-hour frame, adhering well to it, and heading for a strong breakout and retest.
We have a bearish trend on the RSI indicator that is about to be broken and retested, which supports the upward breakout.
There is a major support area in green at 1.70, representing a strong support point.
We are heading for consolidation above the 100 moving average.
Entry price: 1.71
First target: 1.74
Second target: 1.78
Third target: 1.82
Don't forget a simple matter: capital management.
When you reach the first target, save some money and then change your stop-loss order to an entry order.
For inquiries, please leave a comment.
Thank you.
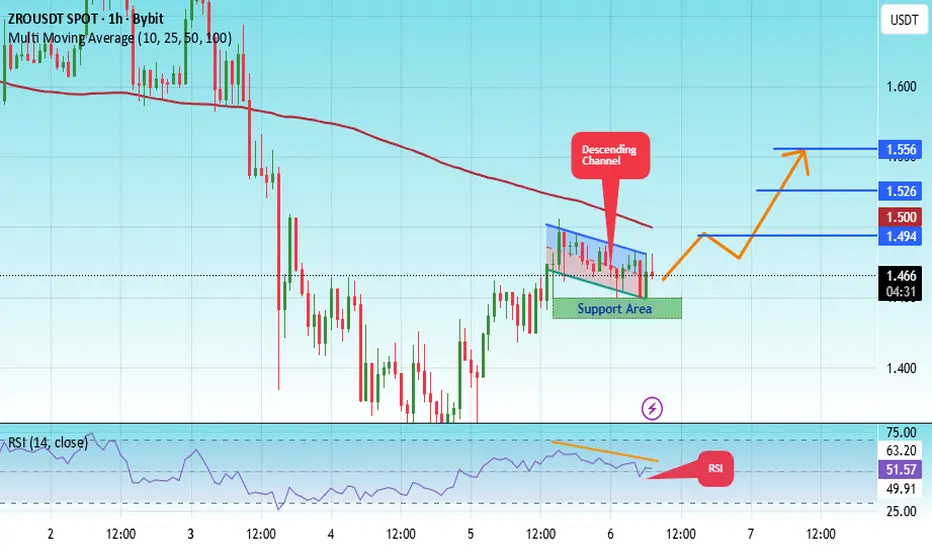
#ZRO/USDT Reversal Potential Breakout & Fibonacci Retest in Fo#ZRO
The price is moving within an ascending channel on the 1-hour timeframe and is adhering to it well. It is poised to break out strongly and retest the channel.
We have a downtrend line on the RSI indicator that is about to break and retest, which supports the upward move.
There is a key support zone in green at the price of 1.44, representing a strong support point.
We have a trend of consolidation above the 100-period moving average.
Entry price: 1.47
First target: 1.49
Second target: 1.52
Third target: 1.55
Don't forget a simple money management rule:
Place your stop-loss order below the support zone in green.
Once the first target is reached, save some money and then change your stop-loss order to an entry order.
For any questions, please leave a comment.
Thank you.
#ZRO/USDT Reversal Potential Breakout & Fibonacci Retest in Fo#ZRO
The price is moving in a descending channel on the 1-hour frame and is expected to break and continue upward.
We have a trend to stabilize above the 100 moving average again.
We have a downtrend on the RSI indicator that supports the upward move with a breakout.
We have a major support area in green that pushed the price higher at 1.63.
Entry price: 1.68.
First target: 1.71.
Second target: 1.76.
Third target: 1.80.
To manage risk, don't forget stop loss and capital management.
The stop loss is below the support area in green.
When the first target is reached, save some profits and then change the stop order to an entry order.
For inquiries, please comment.
Thank you.
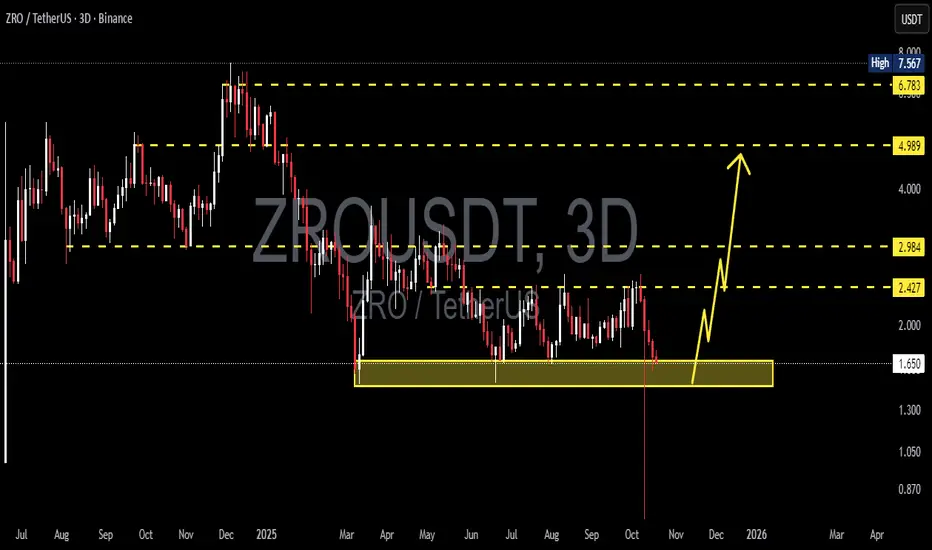
ZRO/USDT — Final Accumulation Phase Before a Major Breakout?ZRO is now sitting at a critical equilibrium point — the market is deciding whether this long accumulation phase will end with a massive bullish reversal or a final breakdown into capitulation.
The support zone at 1.465–1.665 (yellow block) has been the final defense that consistently absorbs selling pressure. Each retest of this zone has triggered a strong bounce, indicating that smart money continues to accumulate in this region.
The sharp wick below support earlier in October suggests a liquidity sweep — retail stop-losses were likely taken out while institutional buyers began accumulating. We may be witnessing the final shakeout phase before a potential vertical rally.
---
Technical Structure & Pattern Analysis
1. Macro Trend (3D):
After the distribution phase at December highs, price has entered a descending structure that flattened into a clear accumulation range.
Selling momentum is weakening — candles show shorter bodies with long lower shadows, signaling absorption by buyers.
2. Golden Support Zone (1.465–1.665):
This has been the battle zone between buyers and sellers for over six months.
Multiple rejections confirm its importance; holding this level could trigger a mid-term reversal.
3. Emerging Patterns:
Base Formation / Accumulation Box: sideways price action forming a solid bottom structure.
Liquidity Sweep Pattern: long wick below support with no sustained close beneath — a classic bear trap.
Potential Hidden Bullish Divergence: if RSI or similar indicators form higher lows while price remains flat, it strengthens the bullish case for accumulation.
---
Bullish Scenario (Reversal Setup & Targets)
Bullish Catalysts:
3D candle closes decisively above 1.80–1.90 with strong volume.
Valid breakout from the accumulation range formed since June.
Target Levels:
1. 2.427 – 2.984: first reaction zone, potential minor pullback.
2. 4.989: mid-range equilibrium level.
3. 6.783 – 7.567: major supply zone — potential macro reversal zone if momentum sustains.
Bullish Narrative:
A breakout from this zone could mark the beginning of a major markup phase, where price starts drawing liquidity upward step by step. Typically, such moves follow a spring phase — already indicated by the previous wick below support.
---
Bearish Scenario (Breakdown & Capitulation)
Bearish Catalysts:
3D close below 1.465.
Failed reclaim of the broken support zone.
Downside Targets:
1. 1.00 – 0.90: psychological zone and prior wick low.
2. If selling persists, potential extension to 0.75 – 0.60, representing a full capitulation phase.
Bearish Narrative:
A confirmed breakdown below 1.465 could trigger mass liquidation and panic selling, pushing price into its final capitulation stage. However, such capitulation events often precede major cyclical bottoms and the start of new uptrends.
---
Conclusion & Strategy
ZRO is positioned in a golden zone between massive accumulation and final destruction.
Patient buyers may wait for a confirmed breakout above resistance for mid-term swing positions.
Aggressive traders could look for entries near the lower part of the range with tight stops below 1.465.
Bears only gain full control if price closes firmly below 1.465 on the 3D timeframe.
If this structure follows a Wyckoff Accumulation pattern, ZRO might currently be in Phase D (Spring/Shakeout) — the final step before a potential impulsive rally.
#ZROUSDT #ZRO #CryptoAnalysis #TechnicalAnalysis #SupportResistance #Wyckoff #Accumulation #Breakout #CryptoTrading #SwingTrade #CryptoMarket #ReversalSetup
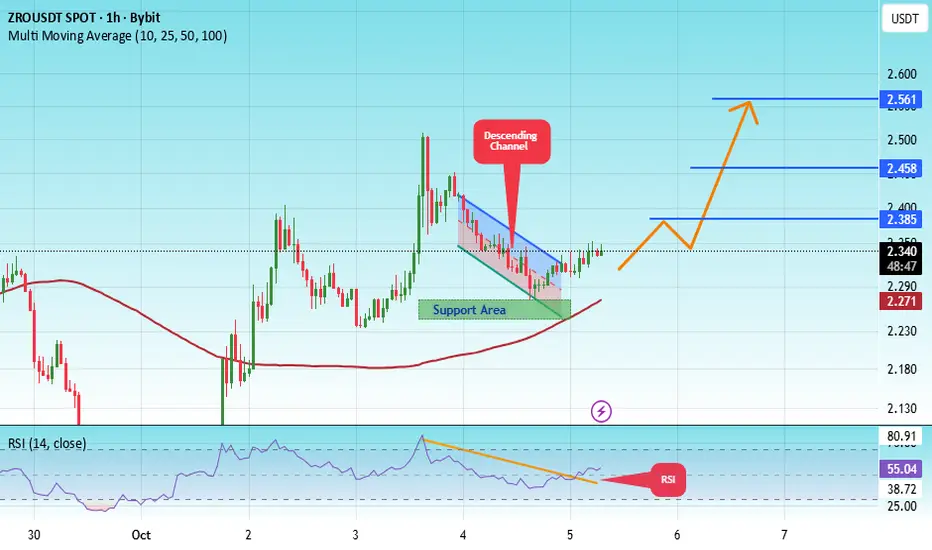
#ZRO/USDT Reversal Potential Breakout & Fibonacci Retest in Fo#ZRO
The price is moving within a descending channel on the 1-hour frame, adhering well to it, and is heading for a strong breakout and retest.
We have a bearish trend on the RSI indicator that is about to be broken and retested, which supports the upward breakout.
There is a major support area in green at 2.24, representing a strong support point.
We are heading for consolidation above the 100 moving average.
Entry price: 2.34
First target: 2.38
Second target: 2.45
Third target: 2.56
Don't forget a simple matter: capital management.
When you reach the first target, save some money and then change your stop-loss order to an entry order.
For inquiries, please leave a comment.
Thank you.
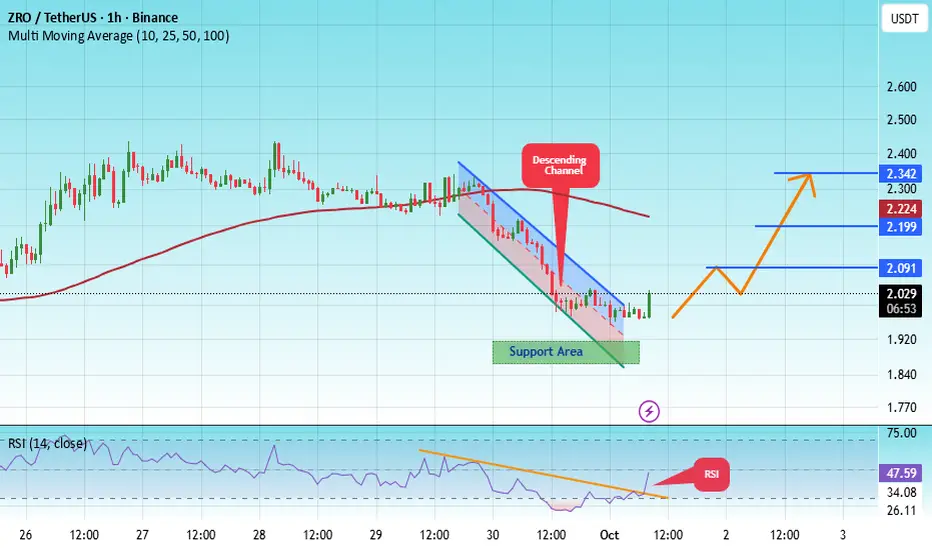
#ZRO/USDT Breaks Out of Rectangle Pattern#ZRO
The price is moving within a descending channel on the 1-hour frame, adhering well to it, and is heading for a strong breakout and retest.
We have a bearish trend on the RSI indicator that is about to be broken and retested, which supports the upward breakout.
There is a major support area in green at 1.87, representing a strong support point.
We are heading for consolidation above the 100 moving average.
Entry price: 2.00
First target: 2.10
Second target: 2.20
Third target: 2.34
Don't forget a simple matter: capital management.
When you reach the first target, save some money and then change your stop-loss order to an entry order.
For inquiries, please leave a comment.
Thank you.
#ZRO/USDT Breaks Out of Rectangle Pattern#ZRO
The price is moving within a descending channel on the 1-hour frame, adhering well to it, and is heading for a strong breakout and retest.
We have a bearish trend on the RSI indicator that is about to be broken and retested, which supports the upward breakout.
There is a major support area in green at 1.95, representing a strong support point.
We are heading for consolidation above the 100 moving average.
Entry price: 2.00
First target: 2.08
Second target: 2.16
Third target: 2.26
Don't forget a simple matter: capital management.
When you reach the first target, save some money and then change your stop-loss order to an entry order.
For inquiries, please leave a comment.
Thank you.