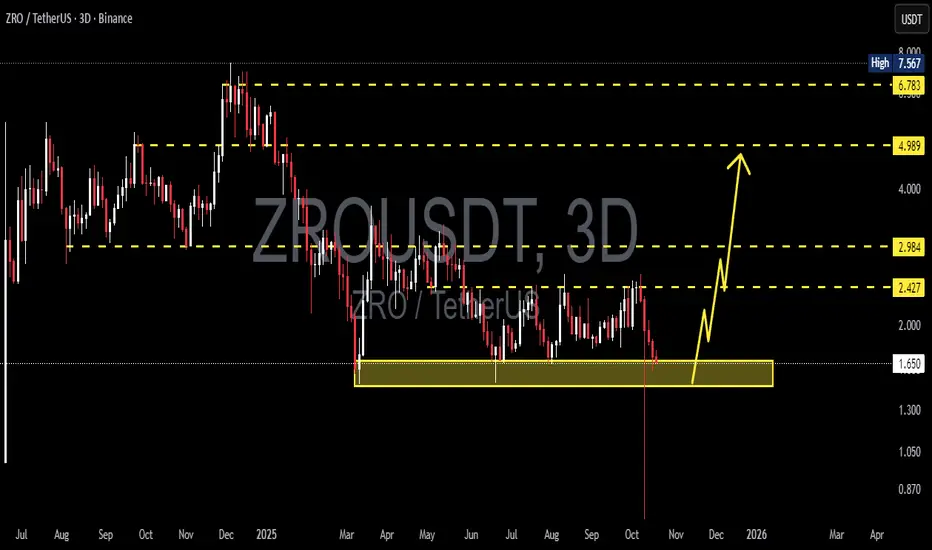
ZRO/USDT — Final Accumulation Phase Before a Major Breakout?ZRO is now sitting at a critical equilibrium point — the market is deciding whether this long accumulation phase will end with a massive bullish reversal or a final breakdown into capitulation.
The support zone at 1.465–1.665 (yellow block) has been the final defense that consistently absorbs selling pressure. Each retest of this zone has triggered a strong bounce, indicating that smart money continues to accumulate in this region.
The sharp wick below support earlier in October suggests a liquidity sweep — retail stop-losses were likely taken out while institutional buyers began accumulating. We may be witnessing the final shakeout phase before a potential vertical rally.
---
Technical Structure & Pattern Analysis
1. Macro Trend (3D):
After the distribution phase at December highs, price has entered a descending structure that flattened into a clear accumulation range.
Selling momentum is weakening — candles show shorter bodies with long lower shadows, signaling absorption by buyers.
2. Golden Support Zone (1.465–1.665):
This has been the battle zone between buyers and sellers for over six months.
Multiple rejections confirm its importance; holding this level could trigger a mid-term reversal.
3. Emerging Patterns:
Base Formation / Accumulation Box: sideways price action forming a solid bottom structure.
Liquidity Sweep Pattern: long wick below support with no sustained close beneath — a classic bear trap.
Potential Hidden Bullish Divergence: if RSI or similar indicators form higher lows while price remains flat, it strengthens the bullish case for accumulation.
---
Bullish Scenario (Reversal Setup & Targets)
Bullish Catalysts:
3D candle closes decisively above 1.80–1.90 with strong volume.
Valid breakout from the accumulation range formed since June.
Target Levels:
1. 2.427 – 2.984: first reaction zone, potential minor pullback.
2. 4.989: mid-range equilibrium level.
3. 6.783 – 7.567: major supply zone — potential macro reversal zone if momentum sustains.
Bullish Narrative:
A breakout from this zone could mark the beginning of a major markup phase, where price starts drawing liquidity upward step by step. Typically, such moves follow a spring phase — already indicated by the previous wick below support.
---
Bearish Scenario (Breakdown & Capitulation)
Bearish Catalysts:
3D close below 1.465.
Failed reclaim of the broken support zone.
Downside Targets:
1. 1.00 – 0.90: psychological zone and prior wick low.
2. If selling persists, potential extension to 0.75 – 0.60, representing a full capitulation phase.
Bearish Narrative:
A confirmed breakdown below 1.465 could trigger mass liquidation and panic selling, pushing price into its final capitulation stage. However, such capitulation events often precede major cyclical bottoms and the start of new uptrends.
---
Conclusion & Strategy
ZRO is positioned in a golden zone between massive accumulation and final destruction.
Patient buyers may wait for a confirmed breakout above resistance for mid-term swing positions.
Aggressive traders could look for entries near the lower part of the range with tight stops below 1.465.
Bears only gain full control if price closes firmly below 1.465 on the 3D timeframe.
If this structure follows a Wyckoff Accumulation pattern, ZRO might currently be in Phase D (Spring/Shakeout) — the final step before a potential impulsive rally.
#ZROUSDT #ZRO #CryptoAnalysis #TechnicalAnalysis #SupportResistance #Wyckoff #Accumulation #Breakout #CryptoTrading #SwingTrade #CryptoMarket #ReversalSetup
Zroanalysis
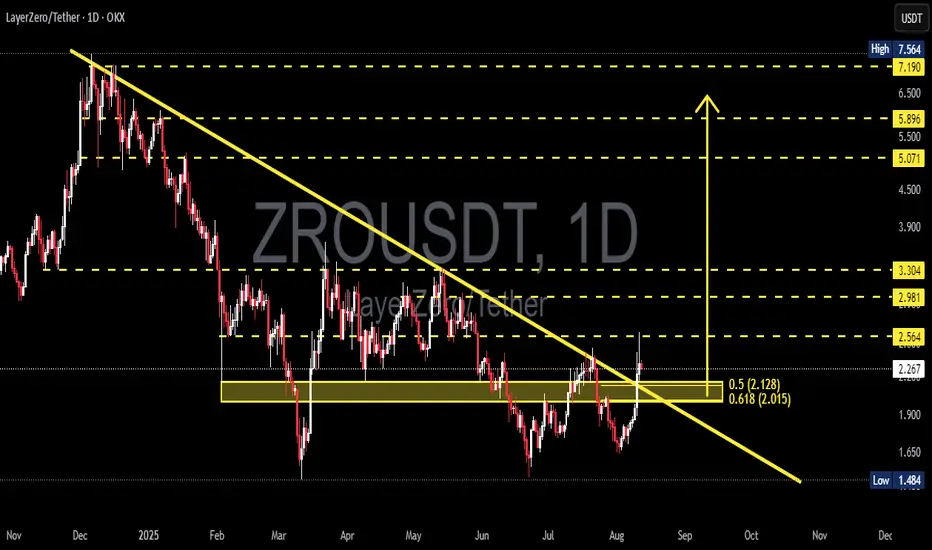
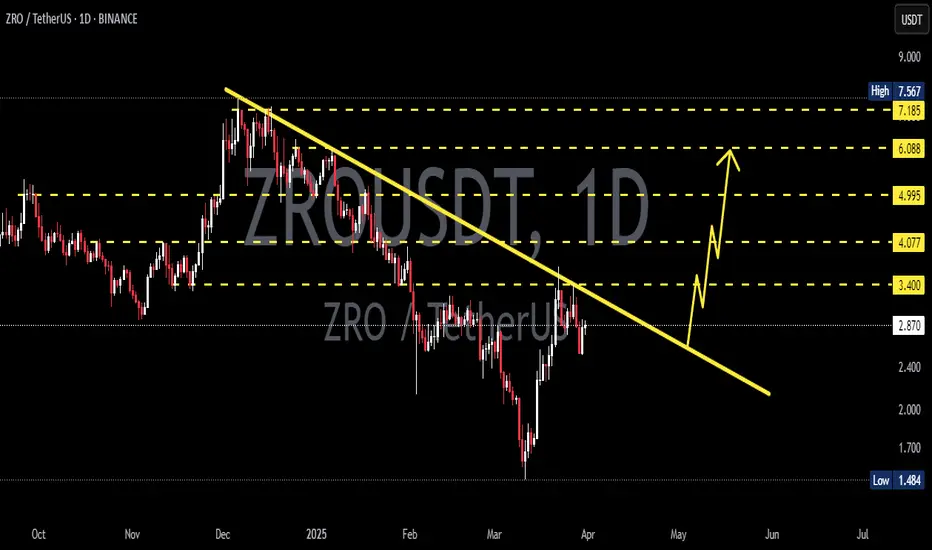
ZRO/USDT — Daily Breakout from Downtrend + Golden Fib Zone!Pattern & Structure
Medium-term trend: Clear downtrend since late last year (yellow diagonal line) with multiple touch points, making it a valid resistance line.
Breakout: Daily candle has closed above the downtrend line and above the yellow box (previous resistance zone). This is an early signal that medium-term selling pressure is weakening.
Golden Fibonacci zone: The yellow box marks the 0.5 = 2.128 and 0.618 = 2.015 retracement levels. This area acted as a supply/resistance and now becomes a potential retest zone (resistance turning into support).
Key horizontal levels (dashed lines):
Near-term: 2.564
Mid-term: 2.981, 3.304
Higher targets: 5.071, 5.896 (major resistance near 7.19)
Major structural low: 1.484
---
Bullish Scenario (if confirmed)
Main confirmation: Sustained daily close above the trendline + yellow box, ideally followed by upward continuation or a successful retest.
Possible target sequence:
First target: 2.564 → ~+12.8% from 2.273
Mid targets: 2.981 → +31.15%, then 3.304 → +45.36%
If momentum continues, possible extension toward 5.071 / 5.896 (>100% from current price).
Extra bullish sign: A retest of the yellow box (2.015–2.128) holding as support and forming higher lows.
---
Bearish Scenario (if failed)
Bearish invalidation trigger: Strong rejection in the breakout zone, followed by daily close back below the 0.5–0.618 range.
Downside risk levels:
Failed retest → drop to 2.128 (−11.4%).
Break below 2.015 → next major support 1.484 (~−34.7% from 2.273).
Losing the trendline + box would likely resume the downtrend.
---
Technical Notes
Breakout validation is key — one daily candle above is not enough, look for 1–3 days of follow-through or a clean retest.
Volume confirmation (not shown in this chart) is important; strong volume = stronger breakout.
Clear invalidation level: Below 0.618 (~2.015). Strong invalidation = 1.484.
Always consider overall crypto market sentiment to avoid false breaks.
---
> ZRO/USDT — Daily breakout from downtrend. Price broke above trendline and Fibonacci 0.5–0.618 (2.128–2.015). Confirmed retest = bullish; failed retest could send price back to 1.48. Not financial advice.
> Structure: Multi-month downtrend (yellow line) has just been broken. The yellow box = Fibonacci 0.5 (2.128) & 0.618 (2.015) cluster — now a key zone.
Bullish: Confirmed close above trendline + retest → targets at 2.564 (+12.8%), 2.981 (+31.2%), 3.304 (+45.4%).
Bearish: Rejection in this zone → back to 2.128 / 2.015 (−6% / −11%), and if broken → 1.484 (−34.7%).
Watch breakout validation, volume, and manage risk. Not financial advice.
#ZRO #ZROUSDT #crypto #cryptocurrency #TA #TechnicalAnalysis #Fibonacci #Breakout #Trendline #Altcoin #SupportResistance
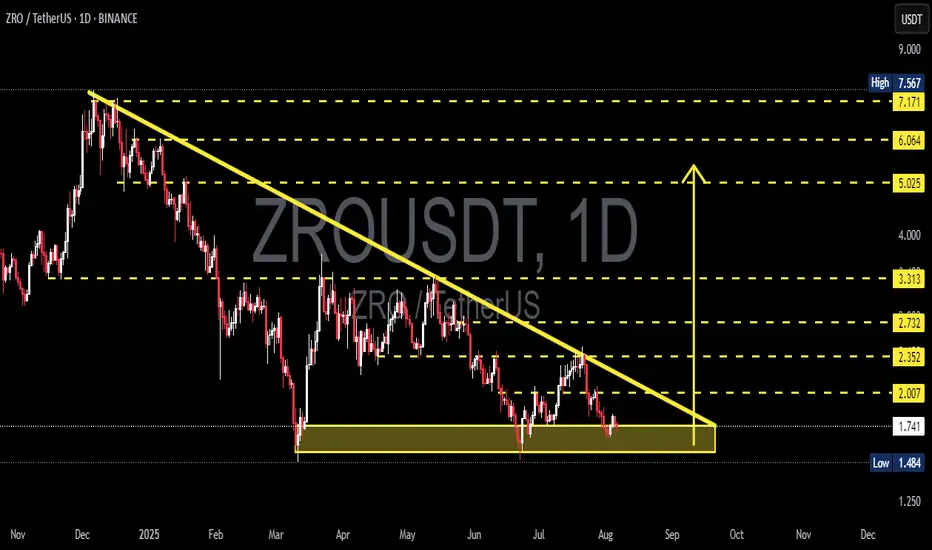
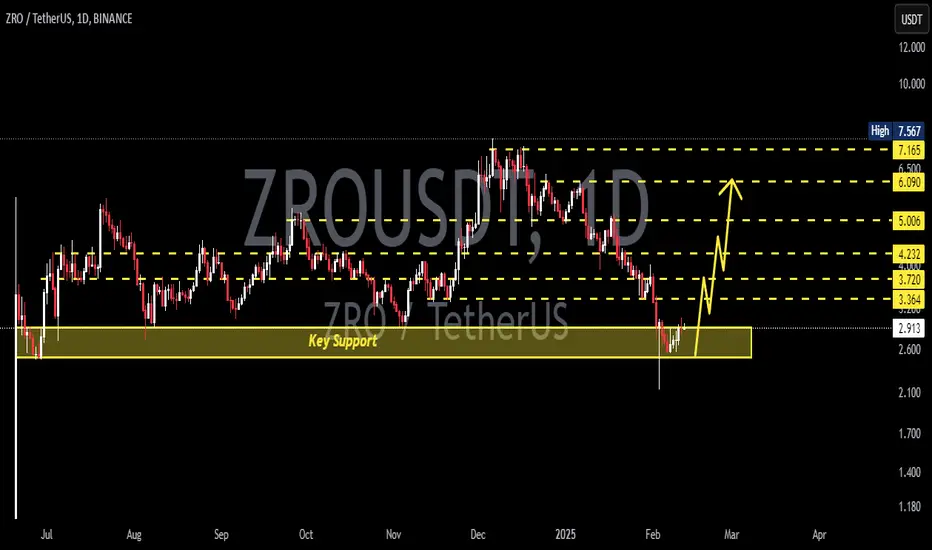
ZRO/USDT Coiled for a Major Move – Breakout or Breakdown?📌 Overview:
The ZRO/USDT pair is currently at a highly critical point. Price action has been consolidating within a large Descending Triangle for several months, and is now coiling near the apex — a classic signal of an incoming major move.
The strong support zone around 1.73 – 1.74 USDT has been tested multiple times and continues to hold, while the long-standing descending trendline from the all-time high acts as key dynamic resistance.
---
📊 Pattern & Market Structure Analysis:
🟡 Pattern: Descending Triangle
Flat horizontal support at ~1.73 USDT has acted as a demand zone.
Consistent lower highs suggest continued selling pressure and market indecision.
While typically a bearish continuation pattern, this setup can also lead to a bullish reversal breakout if resistance is breached with volume.
🧱 Key Support:
The highlighted yellow box shows clear accumulation, where buyers continue to defend the zone.
A breakdown below this support could trigger sharp downside movement and panic selling.
📉 Descending Resistance:
The downward sloping trendline is the critical breakout level.
A strong daily candle close above it would invalidate the bearish structure.
---
🚀 Bullish Scenario (Breakout):
If the price successfully breaks above the descending trendline with volume:
Short-term targets: 2.007 → 2.352 USDT
Mid-term targets: 2.732 → 3.313 USDT
Long-term bullish targets: 5.025 – 6.064 USDT and beyond
Additional confirmations: Volume spike, bullish RSI breakout, daily close above resistance.
---
🔻 Bearish Scenario (Breakdown):
If price fails to hold 1.73 USDT and breaks down:
Initial downside target: 1.484 USDT (historical support)
If that fails, ZRO may enter new low zones below 1.40
Breakdown with high volume would validate a strong bearish trend continuation.
---
🧠 Possible Strategies:
Breakout traders: Entry on daily candle close above descending trendline with volume.
Retest buyers: Wait for breakout, then enter on a successful retest of the trendline as new support.
Short sellers: Look for breakdown below 1.73 zone for short opportunities to 1.48 or lower.
Always use tight stop-loss based on volatility and support/resistance zones.
---
📈 Conclusion:
ZRO is at a make-or-break point. The market is coiling tightly within a Descending Triangle, and a massive move is likely just around the corner. Whether that move is up or down will depend on how price reacts to the descending trendline and the horizontal support.
Traders should stay alert and watch for either a confirmed breakout above the trendline, or a confirmed breakdown below the 1.73 USDT support level. The reaction here will set the tone for ZRO’s next big trend.
#ZRO #ZROUSDT #CryptoBreakout #TechnicalAnalysis #DescendingTriangle #AltcoinSetup #SupportAndResistance #CryptoChart #BreakoutWatch
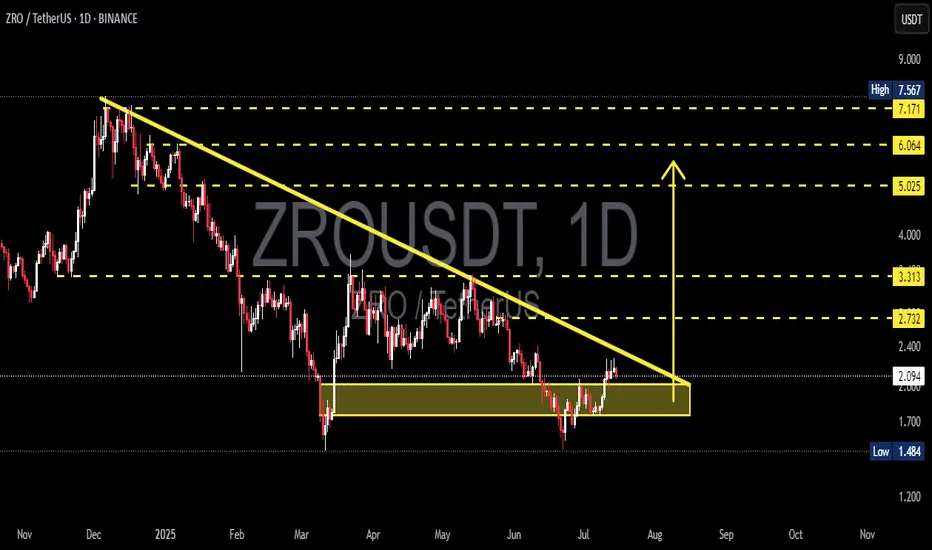
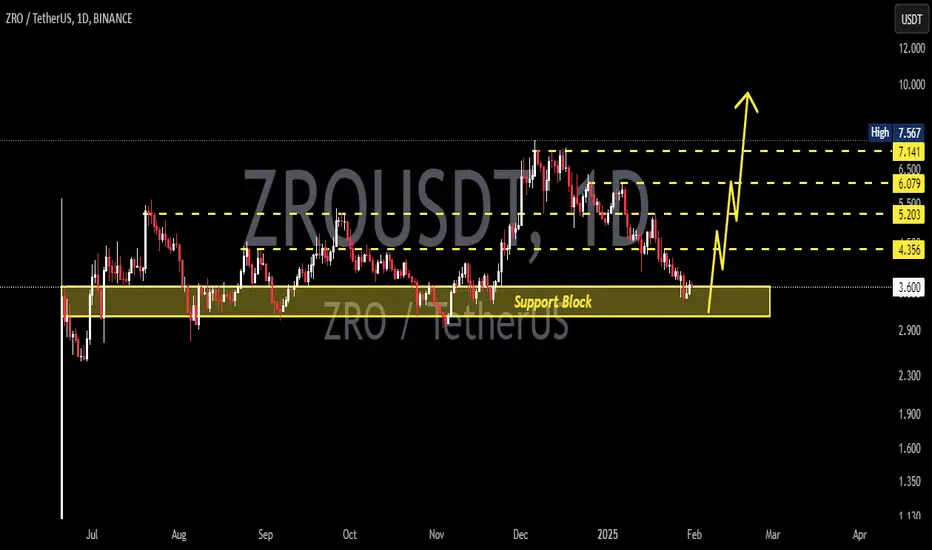
ZRO/USDT Breakout Watch – Ready to Rally After Being TrappedZRO is currently in a technically significant phase. After months of relentless selling pressure, the price action is now forming a classic Descending Triangle, and price is testing the upper boundary of this structure. A breakout from this zone could trigger a strong bullish reversal with multi-stage targets ahead.
🧩 Pattern Structure & Price Action:
📐 Descending Triangle (Potential Reversal)
Lower Highs have been forming since November 2024.
Strong horizontal support at $1.90 – $2.00, tested multiple times.
Price volatility is compressing, which often precedes a breakout.
This pattern is often considered bearish, but in this extended downtrend context, it can become a bullish reversal pattern if price breaks out to the upside with strong volume.
📊 Key Zones & Target Levels if Breakout Happens:
1. 🔹 $2.30 – Breakout confirmation zone (trendline break).
2. 🔹 $2.73 – Minor resistance from previous structure.
3. 🔹 $3.31 – Strong psychological and historical resistance.
4. 🔹 $5.02 – Primary breakout target based on pattern height.
5. 🔹 $6.06 – $6.50 – Mid-term extension target based on Fibonacci and prior supply zone.
6. 🔹 $7.17 – $7.56 – Extended bullish target in case of strong rally continuation.
🟢 Bullish Scenario:
If price breaks out with a strong daily close above $2.30 accompanied by volume:
Buyers gain control.
Descending triangle becomes a launchpad for upward momentum.
Gradual rally toward $5 and beyond becomes very likely over the next few weeks.
🔴 Bearish Scenario:
If price fails to break the resistance and instead drops below $1.90:
Price could fall toward $1.60 as near-term support.
If bearish pressure continues, price may test the $1.48 support zone (previous local bottom).
Structure remains bearish until significant buying pressure returns.
🧭 Conclusion:
ZRO is at a critical decision point. A clean breakout from this pattern could be the beginning of a major recovery rally. However, failure to break resistance could lead to another leg of consolidation or downside. This is a high-opportunity setup for traders watching for volume and confirmation.
#ZRO #ZROUSDT #CryptoBreakout #TechnicalAnalysis #AltcoinSeason #CryptoTrading #DescendingTriangle #ReversalPattern #ChartAnalysis
#ZRO/USDT#ZRO
The price is moving within a descending channel on the 1-hour frame, adhering well to it, and is heading toward a strong breakout and retest.
We are seeing a bounce from the lower boundary of the descending channel, which is support at 2.41.
We have a downtrend on the RSI indicator that is about to be broken and retested, supporting the upward trend.
We are looking for stability above the 100 Moving Average.
Entry price: 2.69
First target: 2.82
Second target: 2.98
Third target: 3.17

ZROUSDT 1D AnalysisZRO ~ 1D Analysis
#ZRO Buy back gradually from here if you still have confidence in this coin with a short term target of at least 10%++ from here.

ZROUSDT 1DZRO ~ 1D Analysis
#ZRO Buy gradually after successfully penetrating this resistant line with a short -term target of at least 10%+.
ZROUSDT - The star of this season!The coin has surged 150% in recent days, despite the overall bearish and depressing market.
This is a strong indication of momentum and growing hype around this coin. The daily chart shows stability at a key support level, highlighted in gray.
-It broke a major downtrend line that had been in place for over 3 months and successfully retested it.
-Long-term targets look extremely bullish, with massive upside potential.
-Holding this key support makes it a perfect entry point for buyers.
-Price projection suggests a reverse H&S pattern completion, followed by a breakout and continuation to the upside.
Everything looks perfectly aligned on the chart!
best regards Ceciliones🎯

ZROUSDT 1DZRO ~ 1D Analysis
#ZRO This is the lowest support block for now. Buy from here if you still have a Conviction on this coin.
ZROUSDT 1DZRO ~ 1D Analysis
#ZRO If you still have a Conviction on this coin. Buy from here with a minimum target of 15%++
#ZRO/USDT Ready to go higher#ZRO
The price is moving in a descending channel on the 30-minute frame and sticking to it well
We have a bounce from the lower limit of the descending channel, this support is at a price of 4.58
We have a downtrend on the RSI indicator that is about to be broken, which supports the rise
We have a trend to stabilize above the 100 moving average
Entry price 4.60
First target 4.70
Second target 4.78
Third target 4.88

#ZRO/USDT Ready to go higher#ZRO
The price is moving in a descending channel on the 1-hour frame and sticking to it well
We have a bounce from the lower limit of the descending channel, this support is at 6.15
We have a downtrend on the RSI indicator that is about to be broken, which supports the rise
We have a trend to stabilize above the moving average 100
Entry price 6.35
First target 6.57
Second target 6.87
Third target 7.21

#ZRO/USDT
#ZRO
The price is moving in a descending channel on a 30-minute frame upwards and is expected to continue.
We have a trend to stabilize above the moving average 100 again.
We have a downtrend on the RSI indicator that supports the rise by breaking it upwards.
We have a support area at the lower limit of the channel at a price of
4.70
Entry price 4.84
First target 4.93
Second target 5.05
Third target 5.20

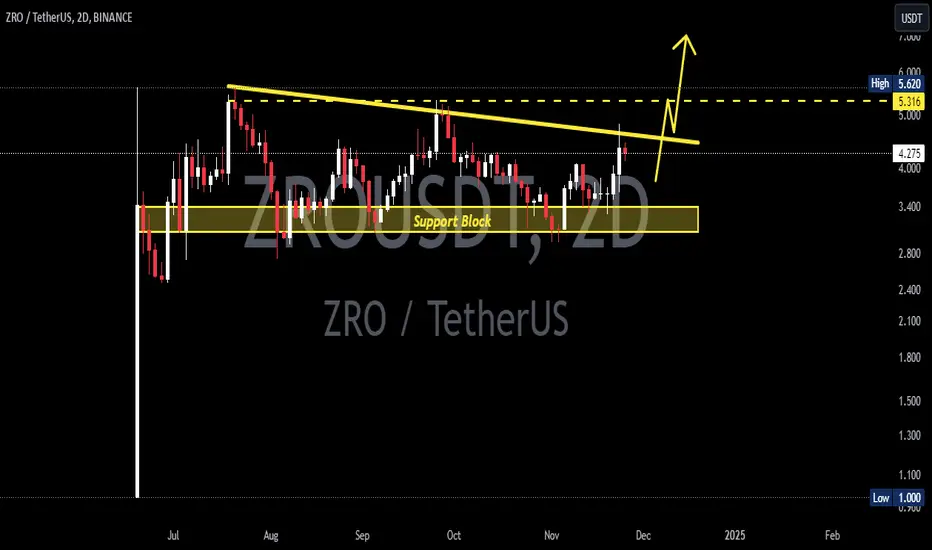
ZROUSDT 2DZRO ~ 2D
#ZRO Forming a bullish pattern on the 2D Time Frame. If you have Conviction on this coin,. Buy gradually inside this pattern,. With a minimum target of 20%+
#ZRO/USDT#ZRO
The price is moving in a descending channel on the 4-hour frame upwards and is expected to continue
We have a trend to stabilize above the moving average 100 again
We have a descending trend on the RSI indicator that supports the rise by breaking it upwards
We have a support area at the lower limit of the channel at a price of 3.30
Entry price 3.38
First target 3.57
Second target 3.70
Third target 3.93

#ZRO/USDT#ZRO
The price is moving in a descending channel on the 4-hour frame
And it is sticking to it well
We have a bounce from the lower limit of the descending channel and we are now touching this support at a price of 3.75
We have a downtrend on the RSI indicator that is about to be broken, which supports the rise
We have a trend to stabilize above the moving average 100
Entry price 4.00
First target 4.15
Second target 4.37
Third target 4.61

#ZRO/USDT#ZRO
The price is moving in a descending channel on the hourly frame and we are about to break it
We have a bounce from a major support area in green at 3.00
We have an uptrend RSI that has been broken upwards
We have a trend to stabilize above the 100 moving average which supports the upside
Entry price 3.34
1st target 3.91
2nd target 4.27
3rd target 4.67

ZROUSDTZRO ~ 1D ✅
#ZRO This is a bullish pattern for now. It will still be necessary to confirm the break of the resistance line of this pattern to confirm.
If you have Conviction on this Coin,. Purchases in this pattern may need to be considered or perhaps you should leave 50% of your USDT for purchases in the demand zone, to maintain Worst possible.

LayerZero May hit $3.8 to $3.6 zones.LayerZero May hit $3.8 to $3.6 zones.
I called to short LayerZero 22 hours ago, we have hit out $4 TP.
The selling momentum is still strong, hopefully, it will get to $3.8 or $3.6

LayerZero ZRO price hold well#ZROUSDT price has held up quite well compared to other altcoins, despite yesterday's and today's drop in the crypto market.
We can assume that the #ZRO price will be well maintained, and maybe even pushed up, at least until 11.07, because it is until this date that the trading promo campaign is valid
You can try trading from level to level, as shown on the chart

#ZRO/USDT#ZRO
The price is moving in a downward channel and has penetrated it and is returning from it strongly
.
We have a bounce from the green support area at 2.80
We have a tendency to stabilize above the Moving Average 100
We have a downtrend on the RSI indicator that is about to break higher and supports the rise
Entry price is 3.25
The first goal is 3.60
The second goal is 3.90
Third goal 4.20
