Zuari - Flag and Pole SetupZuari Stock after giving decent run and then a healthy retracement looks like it is again getting ready for the next run. Keep an eye on Zuari.
ZUARI
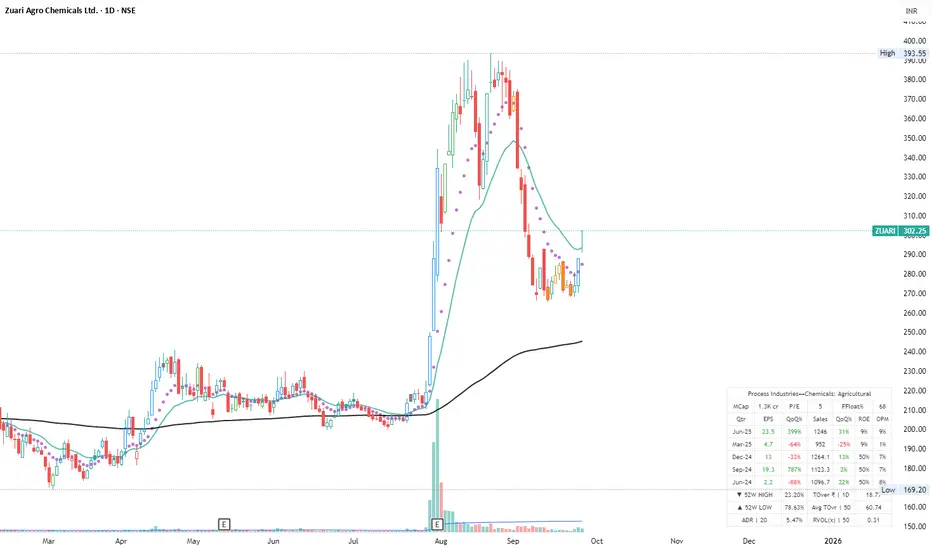
Looking for Zuari's Golden Zone - Fib RetracementZuari's fib retracement on the daily chart on the run up from 200 to 390 shows a clear pullback to 38.2% followed by a failed attempt to break 100% in a seeming double top formation around 390, invalidating immediate bullish momentum.
Daily Macd and RSI look weak with bearish divergences forming against PA, denoted with green brush lines showing both indicators with lower highs against price's equal high.
A retest of the golden zone (61.8% to 78.6%) puts us between roughly 240 and 275, which should offer a high probability zone for accumulation and eventually a bounce.
Look out for confluences of major fib levels with 1d 50ma, 99ma and 200ma. 61.8% also has a horizontal confluence with the Dec 3rd peak, and 78.6% has horizontal confluence with April 24th peak, also potentially infleuntial to support levels.

ZUARI INDUSTRIES LTDThis stock gave good breakout with huge volume and stock gave good opportunity foe swing trade SL below 200 and this is only for educational purpose only

ZUARI has given good breakout.ZUARI it has given good breakout today in the chart I have shared my view.
from here we can plan this trade.
Good Breakout
Good Volumes
Good RR
Good Setup
