PROTECTED SOURCE SCRIPT
Updated RSI SR by Kred-Allino
Hello Trader,
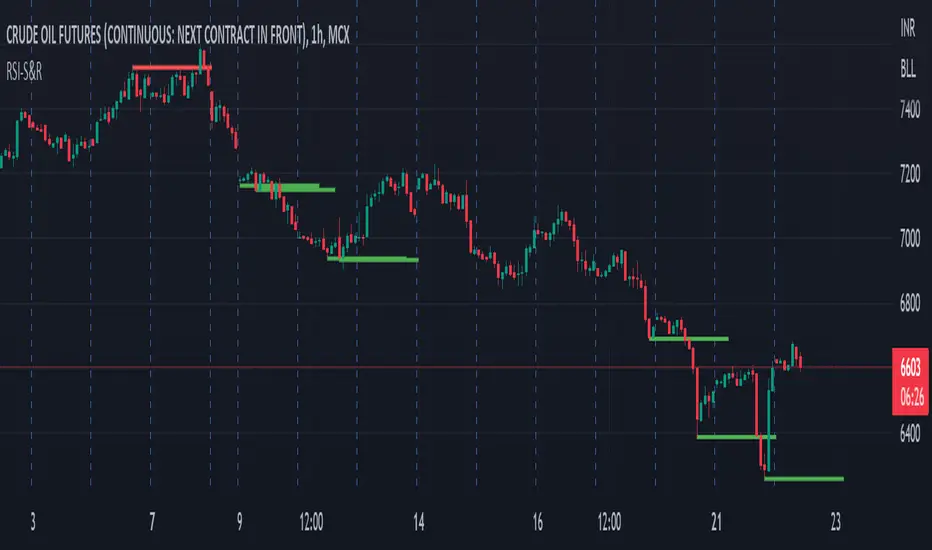
This indicator is draw Support & Resistance Level based on RSI Calculation, It will help you to find Support and Resistance very Easily.
Red Color Line - Resistance
Green Color Line - Support
RSI comes up from the OS region. So it's good time to do the calculation with.
- Find out the lowest RSI value from the RSI array
- Get the corresponding low price from the price array
- Get the corresponding bar_index from bar_index array
- Draw the demand/support line on that price
This Indicator is made for Educational Purpose only, Author will not liable for direct or indirect for any losses due to use of Indicator.
Release Notes
Color ChangedProtected script
This script is published as closed-source. However, you can use it freely and without any limitations – learn more here.
Disclaimer
The information and publications are not meant to be, and do not constitute, financial, investment, trading, or other types of advice or recommendations supplied or endorsed by TradingView. Read more in the Terms of Use.
Protected script
This script is published as closed-source. However, you can use it freely and without any limitations – learn more here.
Disclaimer
The information and publications are not meant to be, and do not constitute, financial, investment, trading, or other types of advice or recommendations supplied or endorsed by TradingView. Read more in the Terms of Use.