OPEN-SOURCE SCRIPT
VXN Williams %R
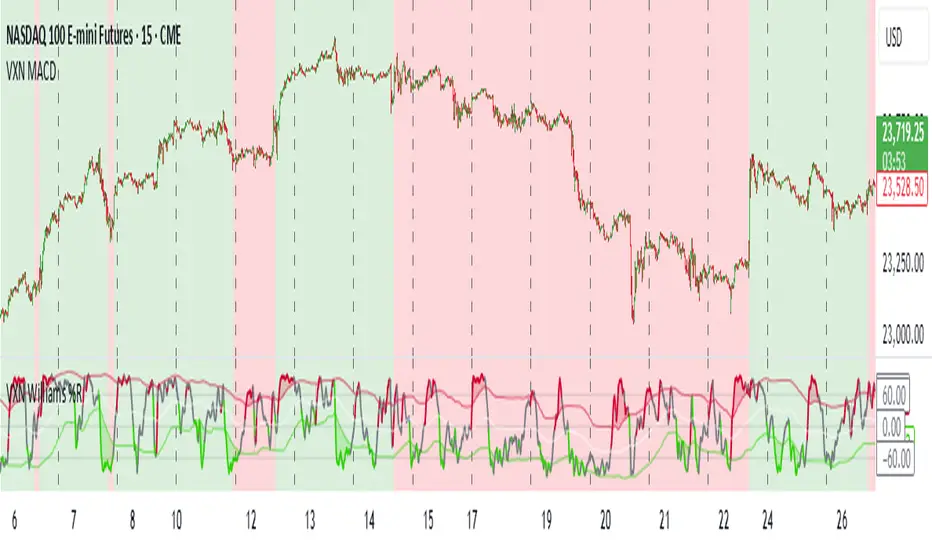
This indicator is based on other open source scripts. It's designed for trading NASDAQ futures using the Williams %R oscillator combined with Bollinger Bands.
The Williams %R is calculated based on a user-defined source and period, then smoothed with a moving average (SMA, EMA, WMA, or RMA).
Bollinger Bands are applied to the scaled Williams %R to identify overbought and oversold conditions.
The background color reflects the trend of the VXN (CBOE NASDAQ Volatility Index):
- Green background: Indicates a bullish trend (VXN EMA < VXN SMA), suggesting long entries at green peaks (Williams %R crossing above the upper Bollinger Band).
- Red background: Indicates a bearish trend (VXN EMA > VXN SMA), suggesting short entries at red peaks (Williams %R crossing below the lower Bollinger Band).
Open-source script
In true TradingView spirit, the creator of this script has made it open-source, so that traders can review and verify its functionality. Kudos to the author! While you can use it for free, remember that republishing the code is subject to our House Rules.
Disclaimer
The information and publications are not meant to be, and do not constitute, financial, investment, trading, or other types of advice or recommendations supplied or endorsed by TradingView. Read more in the Terms of Use.