Trading Mastery Indicator
## Overview
The Trading Mastery Indicator is a professional-grade technical analysis tool that provides high-probability trading signals with complete trade management information including entry, stop loss, and take profit levels.
## Key Features
- High-Quality Signal Detection: Identifies strong, medium, and weak trading opportunities
- Complete Trade Setup: Provides entry, stop loss, and take profit for every signal
- Risk Management: Calculates risk-to-reward ratios automatically
- Elliott Wave Analysis: Integrated wave pattern and position analysis
- Active Signal Tracking: Shows when you're currently in a trade
- Professional Alerts: Detailed notifications with all trade parameters
## Signal Quality Classification
### STRONG Signals (Premium Quality)
- Reliability: Highest probability setups
- Market Conditions: Strong trending environments
- Color: Teal for buys, Red for sells
- When to Trade: These are your primary trading opportunities
- Risk Profile: Lowest risk, highest reward potential
### MEDIUM Signals (Standard Quality)
- Reliability: Good probability setups
- Market Conditions: Moderate trend or consolidation breakouts
- Color: Gold for buys, Purple for sells (Change to Blue Gray)
- When to Trade: Secondary opportunities when strong signals are scarce
- Risk Profile: Moderate risk, good reward potential
### WEAK Signals (Entry Quality)
- Reliability: Lower probability setups
- Market Conditions: Counter-trend or unclear market structure
- Color: Coral for buys, Pink for sells
- When to Trade: Only for experienced traders in specific market conditions
- Risk Profile: Higher risk, variable reward
## How to Use the Indicator
### 1. Signal Settings Configuration
Signal Filter Options:
- All Signals: Shows every trading opportunity (strong, medium, weak)
- High Quality Only: Shows only the highest probability setups
- High + Medium Quality**: Balanced approach filtering out weak signals
Recommended Settings by Experience:
- Beginner: Use "High Quality Only"
- Intermediate: Use "High + Medium Quality"
- Advanced: Use "All Signals" with proper risk management
Label Controls:
- Label Position: Adjust how close labels appear to candles
- Label Text Size: Choose based on screen size and preference
- Maximum Labels: Control chart clutter (recommended: 20)
### 2. Understanding the Professional Panel
The panel provides real-time market intelligence:
Primary Trend: Market direction analysis
- BULLISH TREND: Look for buy opportunities only
- BEARISH TREND: Look for sell opportunities only
- CONSOLIDATION: Market indecision, trade with caution
Wave Pattern: Elliott Wave structure analysis
- IMPULSE UP: Strong bullish momentum
- IMPULSE DOWN: Strong bearish momentum
- CORRECTION: Sideways/corrective movement
Wave Position: Current Elliott Wave position
- WAVE 3 (STRONG): Most powerful moves, best for trend following
- WAVE 1 OR 5: Beginning or ending waves
- WAVE 2 OR 4: Corrective phases, lower probability
- CORRECTIVE ABC: Wait for pattern completion
Signal Grade: Current signal status
- SIGNAL ACTIVE: You're currently in a trade
- PREMIUM/STANDARD/SPECULATIVE: New signal quality
- NO SIGNAL: No current opportunities
Trading Bias: Overall market direction
- LONG BIAS: Focus on buy opportunities
- SHORT BIAS: Focus on sell opportunities
- NEUTRAL: No clear directional bias
### 3. Reading Signal Labels
Each signal provides complete trade setup information:
```
STRONG BUY
━━━━━━━━━━━━━━━━━━━━
💰 Entry: 1875.50
🛡️ SL: 1860.25
🎯 TP: 1905.75
📈 R:R = 1:2.0
━━━━━━━━━━━━━━━━━━━━
```
Understanding the Information:
- Entry: Exact price level to enter the trade
- SL: Stop loss level (risk management)
- TP: Take profit level (profit target)
- R:R: Risk-to-reward ratio (1:2.0 means you risk 1 to make 2)
### 4. Entry/TP/SL Level Lines
Visual trade management aids:
- Blue Solid Line: Entry level
- Red Dashed Line: Stop loss level
- Green Dashed Line: Take profit level
- Small Labels: "ENTRY", "SL", "TP" markers
## Trading Strategy Guidelines
### Trend Following Strategy
1. Check Panel: Ensure trend aligns with your trade direction
2. Wait for Signals: Only trade in the direction of the primary trend
3. Quality First: Focus on STRONG signals during trending markets
4. Wave Timing: WAVE 3 positions offer the best trending opportunities
### Reversal Strategy
1. Look for Divergence: Panel shows trend change signals
2. Wait for Confirmation: Don't jump early on potential reversals
3. Use MEDIUM Signals: Often good for catching early trend changes
4. Watch Wave Position: CORRECTIVE ABC patterns may signal trend completion
### Risk Management Rules
Position Sizing:
- Risk no more than 1-2% of account per trade
- Use the provided R:R ratios to calculate position sizes
- Stronger signals can justify slightly larger positions
Stop Loss Management:
- Always use the provided stop loss levels
- Never move stops against your position
- Consider trailing stops once trade moves in your favor
Take Profit Strategy:
- Use provided TP levels as minimum targets
- Consider taking partial profits at TP level
- Let strong trends run beyond TP in trending markets
## Best Practices by Timeframe
### Scalping (M1-M5)
- Use "High Quality Only" filter
- Focus on STRONG signals only
- Quick entry and exit
- Expect more false signals due to market noise
### Intraday Trading (M15-H1)
- Use "High + Medium Quality" filter
- Good balance of opportunity and reliability
- Hold trades for several hours
- Most versatile timeframe for the indicator
### Swing Trading (H4-Daily)
- Use "All Signals" with proper analysis
- Hold trades for days to weeks
- Most reliable signals on higher timeframes
- Best for beginners due to less noise
## Panel Customization
Position Options:
- Top Right: Default, doesn't interfere with price action
- Top Left: Good for wide screens
- Bottom corners: Keeps important info visible while analyzing tops
- Middle positions: Central reference, good for multi-monitor setups
Size Options:
- Small: Minimal screen space, good for small screens
- Normal: Balanced visibility and space usage
- Large: Easy reading, good for detailed analysis
Transparency: Adjust 0-95% based on preference and chart background
## Common Mistakes to Avoid
### Signal Interpretation Errors
- Don't ignore the trend: Trading against primary trend reduces success
- Don't chase weak signals: Focus on quality over quantity
- Don't ignore wave position: WAVE 2/4 corrections are lower probability
### Risk Management Errors
- Don't skip stop losses: Every signal includes SL for a reason
- Don't risk too much: Even strong signals can fail
- Don't move stops against position: Stick to the plan
### Psychological Errors
- Don't overtrade: Wait for quality setups
- Don't second-guess strong signals: Trust the analysis
- Don't panic on normal drawdowns: Expect some losing trades
## Alert Configuration
Enable alerts for:
- Strong signals: Primary trading opportunities
- Medium signals: Secondary opportunities (optional)
- Signal active status: Know when you're in trades
Alert messages include complete trade information for easy execution.
## Performance Optimization
### For Best Results:
1. Combine with price action: Look for confluence with support/resistance
2. Consider market sessions: Different sessions have different characteristics
3. Monitor news events: Avoid trading during high-impact news
4. Keep a trading journal: Track which signals work best for your style
### Regular Review:
- Weekly analysis: Review which signal types performed best
- Timeframe assessment: Determine your most profitable timeframes
- Strategy refinement: Adjust filters based on performance data
## Troubleshooting
If you're not seeing signals:
- Check that "Show Buy/Sell Signals" is enabled
- Verify your signal filter isn't too restrictive
- Market may be in a consolidation phase
If labels are cluttered:
- Reduce "Maximum Labels to Show"
- Change label position to "Far from Candle"
- Use smaller label text size
If panel is in the way:
- Change panel position
- Increase transparency
- Reduce panel size
- Toggle panel off temporarily
Remember: This indicator provides analysis and signals, but successful trading also requires proper risk management, emotional discipline, and understanding of market conditions. Always practice with demo accounts before risking real capital, and never risk more than you can afford to lose.
## Overview
The Trading Mastery Indicator is a professional-grade technical analysis tool that provides high-probability trading signals with complete trade management information including entry, stop loss, and take profit levels.
## Key Features
- High-Quality Signal Detection: Identifies strong, medium, and weak trading opportunities
- Complete Trade Setup: Provides entry, stop loss, and take profit for every signal
- Risk Management: Calculates risk-to-reward ratios automatically
- Elliott Wave Analysis: Integrated wave pattern and position analysis
- Active Signal Tracking: Shows when you're currently in a trade
- Professional Alerts: Detailed notifications with all trade parameters
## Signal Quality Classification
### ALPHA Signals (Premium Quality)
- Reliability: Highest probability setups
- Market Conditions: Strong trending environments
- Color: Black
- When to Trade: These are your primary trading opportunities
- Risk Profile: Lowest risk, highest reward potential
### BETA Signals (Standard Quality)
- Reliability: Good probability setups
- Market Conditions: Moderate trend or consolidation breakouts
- Color: Gray
- When to Trade: Secondary opportunities when strong signals are scarce
- Risk Profile: Moderate risk, good reward potential
### GAMMA Signals (Entry Quality)
- Reliability: Lower probability setups
- Market Conditions: Counter-trend or unclear market structure
- Color: Teal for buys, Red for sells
- When to Trade: Only for experienced traders in specific market conditions
- Risk Profile: Higher risk, variable reward
## How to Use the Indicator
### 1. Signal Settings Configuration
Signal Filter Options:
- All Signals: Shows every trading opportunity (ALPHA, BETA, GAMMA)
- GAMMA Quality Only: Shows only the highest probability setups
- GAMMA + BETA Quality**: Balanced approach filtering out weak signals
Recommended Settings by Experience:
- Beginner: Use "GAMMA Quality Only"
- Intermediate: Use "ALPHA + Medium Quality"
- Advanced: Use "All Signals" with proper risk management
Label Controls:
- Label Position: Adjust how close labels appear to candles
- Label Text Size: Choose based on screen size and preference
- Maximum Labels: Control chart clutter (recommended: 20)
### 2. Understanding the Professional Panel
The panel provides real-time market intelligence:
Primary Trend: Market direction analysis
- BULLISH TREND: Look for buy opportunities only
- BEARISH TREND: Look for sell opportunities only
- CONSOLIDATION: Market indecision, trade with caution
Wave Pattern: Elliott Wave structure analysis
- IMPULSE UP: Strong bullish momentum
- IMPULSE DOWN: Strong bearish momentum
- CORRECTION: Sideways/corrective movement
Wave Position: Current Elliott Wave position
- WAVE 3 (STRONG): Most powerful moves, best for trend following
- WAVE 1 OR 5: Beginning or ending waves
- WAVE 2 OR 4: Corrective phases, lower probability
- CORRECTIVE ABC: Wait for pattern completion
Signal Grade: Current signal status
- SIGNAL ACTIVE: You're currently in a trade
- PREMIUM/STANDARD/SPECULATIVE: New signal quality
- NO SIGNAL: No current opportunities
Trading Bias: Overall market direction
- LONG BIAS: Focus on buy opportunities
- SHORT BIAS: Focus on sell opportunities
- NEUTRAL: No clear directional bias
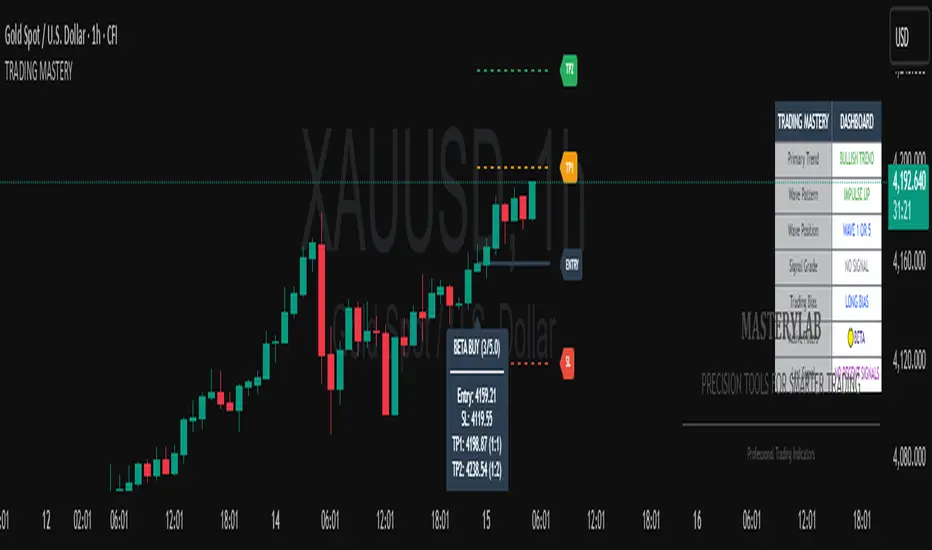
### 3. Reading Signal Labels
Each signal provides complete trade setup information:
STRONG BUY
━━━━━━━━━━━━━━━━━━━━
Entry: 1875.50
SL: 1860.25
TP: 1905.75
R:R = 1:2.0
━━━━━━━━━━━━━━━━━━━━
Understanding the Information:
- Entry: Exact price level to enter the trade
- SL: Stop loss level (risk management)
- TP: Take profit level (profit target)
- R:R: Risk-to-reward ratio (1:2 = means you risk 1 to make reward 2)
### 4. Entry/TP/SL Level Lines
Visual trade management aids:
- Blue Solid Line: Entry level
- Red Dashed Line: Stop loss level
- Green Dashed Line: Take profit level
- Small Labels: "ENTRY", "SL", "TP" markers
## Trading Strategy Guidelines
### Trend Following Strategy
1. Check Panel: Ensure trend aligns with your trade direction
2. Wait for Signals: Only trade in the direction of the primary trend
3. Quality First: Focus on STRONG signals during trending markets
4. Wave Timing: WAVE 3 positions offer the best trending opportunities
### Reversal Strategy
1. Look for Divergence: Panel shows trend change signals
2. Wait for Confirmation: Don't jump early on potential reversals
3. Use MEDIUM Signals: Often good for catching early trend changes
4. Watch Wave Position: CORRECTIVE ABC patterns may signal trend completion
### Risk Management Rules
Position Sizing:
- Risk no more than 1-2% of account per trade
- Use the provided R:R ratios to calculate position sizes
- Stronger signals can justify slightly larger positions
Stop Loss Management:
- Always use the provided stop loss levels
- Never move stops against your position
- Consider trailing stops once trade moves in your favor
Take Profit Strategy:
- Use provided TP levels as minimum targets
- Consider taking partial profits at TP level
- Let strong trends run beyond TP in trending markets
## Best Practices by Timeframe
### Scalping (M1-M5)
- Use "Gamma + Quality Only" filter
- Focus on STRONG signals only
- Quick entry and exit
- Expect more false signals due to market noise
### Intraday Trading (M15-H1)
- Use "All Signals" filter
- Good balance of opportunity and reliability
- Hold trades for several hours
- Most versatile timeframe for the indicator
### Swing Trading (H4-Daily)
- Use "All Signals" with proper analysis
- Hold trades for days to weeks
- Most reliable signals on higher timeframes
- Best for beginners due to less noise
## Panel Customization
Position Options:
- Top Right: Default, doesn't interfere with price action
- Top Left: Good for wide screens
- Bottom corners: Keeps important info visible while analyzing tops
- Middle positions: Central reference, good for multi-monitor setups
Size Options:
- Small: Minimal screen space, good for small screens
- Normal: Balanced visibility and space usage
- Large: Easy reading, good for detailed analysis
Transparency: Adjust 0-95% based on preference and chart background
## Common Mistakes to Avoid
### Signal Interpretation Errors
- Don't ignore the trend: Trading against primary trend reduces success
- Don't chase weak signals: Focus on quality over quantity
- Don't ignore wave position: WAVE 2/4 corrections are lower probability
### Risk Management Errors
- Don't skip stop losses: Every signal includes SL for a reason
- Don't risk too much: Even strong signals can fail
- Don't move stops against position: Stick to the plan
### Psychological Errors
- Don't overtrade: Wait for quality setups
- Don't second-guess strong signals: Trust the analysis
- Don't panic on normal drawdowns: Expect some losing trades
User can manually Show/Hide every signals type
🟢 GAMMA Signals
🟡 BETA Signals
🔴 ALPHA Signals
Real-time dashboard showing:
Primary trend direction
Elliott Wave pattern and position
Current signal grade
Trading bias (Long/Short/Neutral)
Active filter settings
Last signal information
1. TP LEVELS
TP1 - For Re-Entry Or Partial Close
TP2 - Final TP
2. MOST ACCURATION SIGNAL
ALPHA - 2.5
BETA - 3.5
GAMMA - 4.5
3. GAMMA QUALITY LEVELS
Strict - Balanced - Relaxed
4. RISK MANAGEMANT INPUTS
User can adjust SL/TP Range based on behavior instrument
Invite-only script
Only users approved by the author can access this script. You'll need to request and get permission to use it. This is typically granted after payment. For more details, follow the author's instructions below or contact MasteryLab directly.
TradingView does NOT recommend paying for or using a script unless you fully trust its author and understand how it works. You may also find free, open-source alternatives in our community scripts.
Author's instructions
MasteryLab is a development hub for cutting-edge indicators and trading systems, designed for traders who demand accuracy, clarity, and an edge in the markets.
t.me/MasteryLabPro
Disclaimer
Invite-only script
Only users approved by the author can access this script. You'll need to request and get permission to use it. This is typically granted after payment. For more details, follow the author's instructions below or contact MasteryLab directly.
TradingView does NOT recommend paying for or using a script unless you fully trust its author and understand how it works. You may also find free, open-source alternatives in our community scripts.
Author's instructions
MasteryLab is a development hub for cutting-edge indicators and trading systems, designed for traders who demand accuracy, clarity, and an edge in the markets.
t.me/MasteryLabPro