PROTECTED SOURCE SCRIPT
Custum Deviation + xEMA_DFMA alpha
This indicator is still an alpha version.
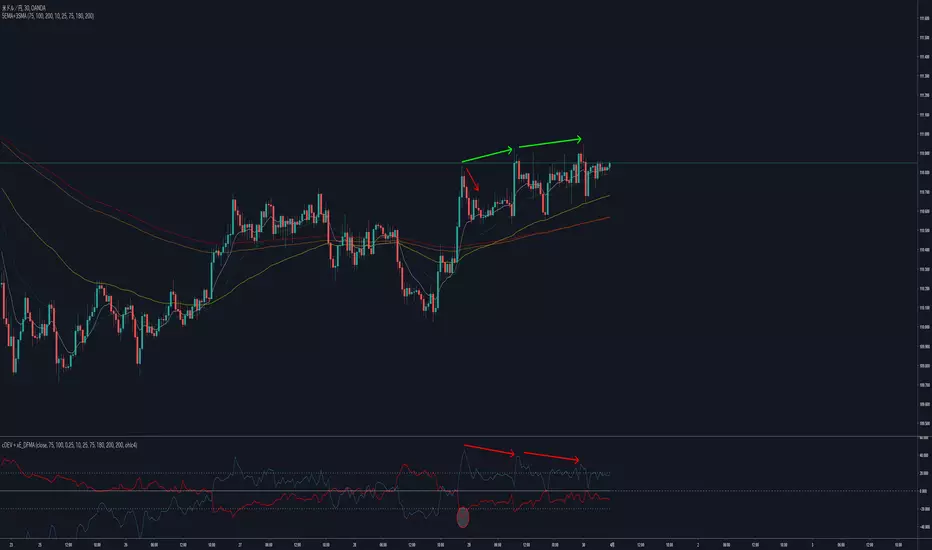
This indicator shows you that deviation from specific EMA (Red Line). It can help you to do Countertrade when price "skyrockets" or "Sudden drop".
Blue Line show you that sum of difference from Moving Average of 5 types EMAs. It shows "Divergence" like MACD.
This indicator shows you that deviation from specific EMA (Red Line). It can help you to do Countertrade when price "skyrockets" or "Sudden drop".
Blue Line show you that sum of difference from Moving Average of 5 types EMAs. It shows "Divergence" like MACD.
Protected script
This script is published as closed-source. However, you can use it freely and without any limitations – learn more here.
Disclaimer
The information and publications are not meant to be, and do not constitute, financial, investment, trading, or other types of advice or recommendations supplied or endorsed by TradingView. Read more in the Terms of Use.