PROTECTED SOURCE SCRIPT
ALEX LIGHT STRATEGY FOR GOOD PEOPLE VERSION 2
Strategy Overview
ALEX TRADING STRATEGY is a multi-indicator technical trading strategy designed to provide a structured decision-making framework, suitable both for traders in a learning phase and for more advanced analytical use.
The strategy is based on the combination of several well-established technical analysis tools, aiming to filter market conditions and identify coherent areas of intervention while reducing market noise.
The core indicators integrated are the Relative Strength Index (RSI), Simple Moving Averages (SMA), Exponential Moving Averages (EMA), and a market structure approach based on Higher High / Lower Low (HHLL) logic.
The objective of the script is not to generate isolated signals, but to provide a multi-factor market reading that combines momentum, trend, and price structure.
General Operating Logic
The strategy allows the user to define the operational bias (long or short) directly through the input settings. Market state and position direction are visualized through color-coded candlesticks, improving readability in live market conditions.
Explicit exit rules are integrated to frame risk management and the closure of open positions. Indicator time settings can be adjusted to suit different assets or trading horizons.
The strategy also includes complementary technical levels such as:
pivot lines,
support and resistance levels,
to further contextualize decision-making.
Indicators Used
Momentum – RSI
The RSI is used to identify overbought and oversold conditions:
RSI > 70: overbought zone
RSI < 30: oversold zone
These levels are displayed graphically to highlight potential market imbalances.
Moving Averages – SMA and EMA
The strategy integrates:
user-configurable SMA,
fixed EMA with periods 20, 50, and 100.
Interactions between closing price and moving averages are used to qualify trend direction and generate conditional entry signals.
Entry Conditions
Two main methodologies are combined:
1. Keltner Channel
Long signal when the closing price crosses above the upper band.
Short signal when the closing price crosses below the lower band.
This approach aims to capture directional market expansion phases.
2. Market Structure – HHLL
The Higher High / Lower Low logic is used to identify structural breakouts:
Long entry when the current high exceeds the highest high of the last n periods,
Short entry when the current low breaks below the lowest low of the last n periods.
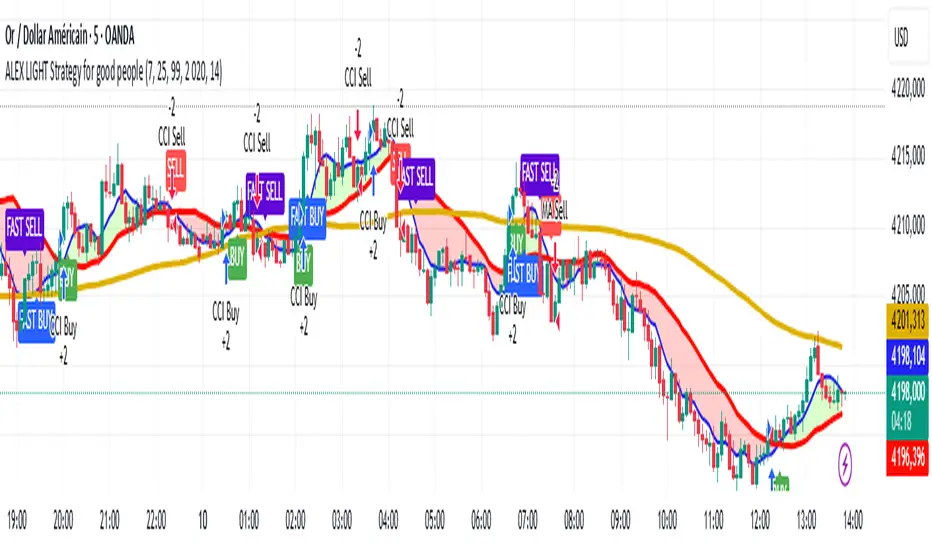
Signals are plotted directly on the chart for immediate visibility.
Exit Conditions and Position Management
Exit rules are based on the Keltner Channel:
Long positions are closed when price moves back below the lower band,
Short positions are closed when price moves back above the upper band.
These mechanisms ensure disciplined position management aligned with market volatility logic.
Market Visualization and Interpretation
The strategy applies candlestick color coding:
Green: active long bias
Red: active short bias
Blue: no position / neutral market
This visual framework is designed to improve clarity and reduce cognitive load during analysis.
Evolutions and Extensions
The strategy has been enhanced with a swing trading module, aimed at capturing price movements over a 1- to 4-day horizon, particularly during periods of moderate volatility.
Additional extensions include:
multi-horizon moving average system (short / medium / long term),
fast crossover signals,
visual trend-confirmation zones,
integration of the CCI indicator to refine entries through momentum filtering.
Disclaimer
This strategy is an analysis and decision-support tool. It does not constitute investment advice and does not guarantee performance.
Any live use must be preceded by thorough testing (backtesting, forward testing) and risk management aligned with the user’s profile.
✅ How to Use – Operational Guidelines
1. Directional Filter (Mandatory)
The first element to consider is the candlestick color:
Green: long setups only
Red: short setups only
Blue: no trade, market not exploitable
No position should ever be taken against the active bias.
2. Trend Validation
Signals are only acted upon when aligned with the trend:
price above EMA levels → bullish context
price below EMA levels → bearish context
Signals are ignored during ranging or heavily compressed market conditions.
3. Entry Execution
Keltner and HHLL signals are used as triggers, not as automatic orders.
Entries are ideally executed:
on a technical pullback,
with momentum confirmation (RSI alignment),
not during impulsive breakout moves.
4. Risk Management
Stop-loss placement should be:
behind a real structural invalidation,
below the last structural low for long positions,
above the last structural high for short positions.
If the stop distance is large, position size must be reduced accordingly.
5. Exit Management
Exits are triggered:
by Keltner Channel rules,
or by a clear change in market context (bias, structure, or momentum).
Partial profit-taking may be applied at intermediate technical levels.
6. Usage Philosophy
ALEX TRADING STRATEGY is designed as a structured decision framework, not as a mechanical signal generator.
Performance quality depends on execution discipline, risk management, and strict respect of market context.
ALEX TRADING STRATEGY is a multi-indicator technical trading strategy designed to provide a structured decision-making framework, suitable both for traders in a learning phase and for more advanced analytical use.
The strategy is based on the combination of several well-established technical analysis tools, aiming to filter market conditions and identify coherent areas of intervention while reducing market noise.
The core indicators integrated are the Relative Strength Index (RSI), Simple Moving Averages (SMA), Exponential Moving Averages (EMA), and a market structure approach based on Higher High / Lower Low (HHLL) logic.
The objective of the script is not to generate isolated signals, but to provide a multi-factor market reading that combines momentum, trend, and price structure.
General Operating Logic
The strategy allows the user to define the operational bias (long or short) directly through the input settings. Market state and position direction are visualized through color-coded candlesticks, improving readability in live market conditions.
Explicit exit rules are integrated to frame risk management and the closure of open positions. Indicator time settings can be adjusted to suit different assets or trading horizons.
The strategy also includes complementary technical levels such as:
pivot lines,
support and resistance levels,
to further contextualize decision-making.
Indicators Used
Momentum – RSI
The RSI is used to identify overbought and oversold conditions:
RSI > 70: overbought zone
RSI < 30: oversold zone
These levels are displayed graphically to highlight potential market imbalances.
Moving Averages – SMA and EMA
The strategy integrates:
user-configurable SMA,
fixed EMA with periods 20, 50, and 100.
Interactions between closing price and moving averages are used to qualify trend direction and generate conditional entry signals.
Entry Conditions
Two main methodologies are combined:
1. Keltner Channel
Long signal when the closing price crosses above the upper band.
Short signal when the closing price crosses below the lower band.
This approach aims to capture directional market expansion phases.
2. Market Structure – HHLL
The Higher High / Lower Low logic is used to identify structural breakouts:
Long entry when the current high exceeds the highest high of the last n periods,
Short entry when the current low breaks below the lowest low of the last n periods.
Signals are plotted directly on the chart for immediate visibility.
Exit Conditions and Position Management
Exit rules are based on the Keltner Channel:
Long positions are closed when price moves back below the lower band,
Short positions are closed when price moves back above the upper band.
These mechanisms ensure disciplined position management aligned with market volatility logic.
Market Visualization and Interpretation
The strategy applies candlestick color coding:
Green: active long bias
Red: active short bias
Blue: no position / neutral market
This visual framework is designed to improve clarity and reduce cognitive load during analysis.
Evolutions and Extensions
The strategy has been enhanced with a swing trading module, aimed at capturing price movements over a 1- to 4-day horizon, particularly during periods of moderate volatility.
Additional extensions include:
multi-horizon moving average system (short / medium / long term),
fast crossover signals,
visual trend-confirmation zones,
integration of the CCI indicator to refine entries through momentum filtering.
Disclaimer
This strategy is an analysis and decision-support tool. It does not constitute investment advice and does not guarantee performance.
Any live use must be preceded by thorough testing (backtesting, forward testing) and risk management aligned with the user’s profile.
✅ How to Use – Operational Guidelines
1. Directional Filter (Mandatory)
The first element to consider is the candlestick color:
Green: long setups only
Red: short setups only
Blue: no trade, market not exploitable
No position should ever be taken against the active bias.
2. Trend Validation
Signals are only acted upon when aligned with the trend:
price above EMA levels → bullish context
price below EMA levels → bearish context
Signals are ignored during ranging or heavily compressed market conditions.
3. Entry Execution
Keltner and HHLL signals are used as triggers, not as automatic orders.
Entries are ideally executed:
on a technical pullback,
with momentum confirmation (RSI alignment),
not during impulsive breakout moves.
4. Risk Management
Stop-loss placement should be:
behind a real structural invalidation,
below the last structural low for long positions,
above the last structural high for short positions.
If the stop distance is large, position size must be reduced accordingly.
5. Exit Management
Exits are triggered:
by Keltner Channel rules,
or by a clear change in market context (bias, structure, or momentum).
Partial profit-taking may be applied at intermediate technical levels.
6. Usage Philosophy
ALEX TRADING STRATEGY is designed as a structured decision framework, not as a mechanical signal generator.
Performance quality depends on execution discipline, risk management, and strict respect of market context.
Protected script
This script is published as closed-source. However, you can use it freely and without any limitations – learn more here.
Disclaimer
The information and publications are not meant to be, and do not constitute, financial, investment, trading, or other types of advice or recommendations supplied or endorsed by TradingView. Read more in the Terms of Use.