Reversal Indicator
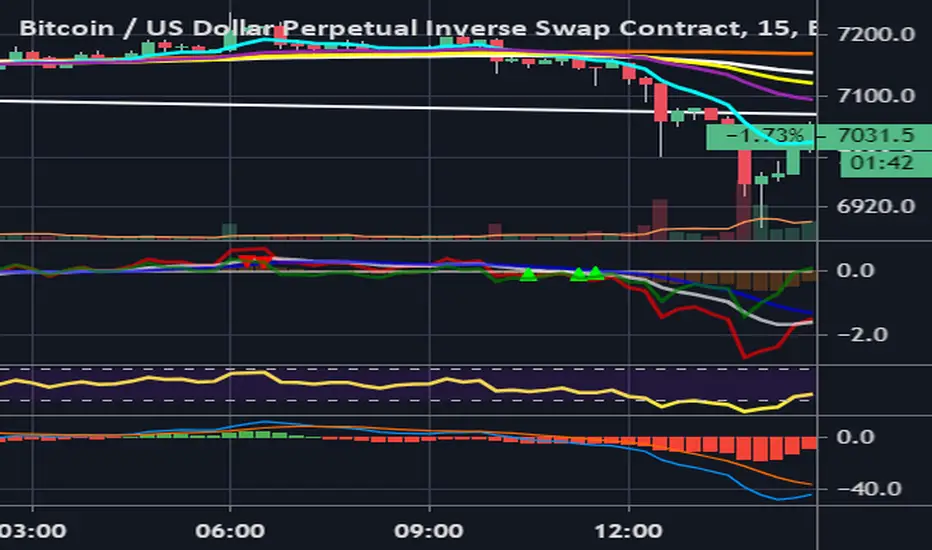
White line is lagging trend line (like MA). When it is above zero axis, it is signaling uptrend and vice versa. The strength of trend is measured by how the red line sustain above the white line and how often the two cross. Indicator can be used on all timeframes, but the higher the timeframe, the stronger the signal with less noise and the greater is the expected move. For example when there is a signal to sell on 1D, 12h and 8h timeframes, it is best to look for good entry signals on 1h, 30m and 15m. On small timeframes (1m - 5m) it works very well during high volatility and high volume periods. During low volume periods there is more noise.
Compared to RSI there are signals formed in times when there is no divergence on RSI.
Invite-only script
Only users approved by the author can access this script. You'll need to request and get permission to use it. This is typically granted after payment. For more details, follow the author's instructions below or contact ladaklada directly.
TradingView does NOT recommend paying for or using a script unless you fully trust its author and understand how it works. You may also find free, open-source alternatives in our community scripts.
Author's instructions
Disclaimer
Invite-only script
Only users approved by the author can access this script. You'll need to request and get permission to use it. This is typically granted after payment. For more details, follow the author's instructions below or contact ladaklada directly.
TradingView does NOT recommend paying for or using a script unless you fully trust its author and understand how it works. You may also find free, open-source alternatives in our community scripts.