PROTECTED SOURCE SCRIPT
CCT Fear & Greed Sincere
📄 CCT Fear & Greed Sincere — Technical Overview
The CCT Fear & Greed Sincere indicator provides a consolidated view of macro-market conditions using exclusively price-derived and market-structure data. The goal is to translate multiple independent risk-appetite components into a unified 0–100 index. This tool does not rely on survey sentiment, alternative datasets, or social indicators; it uses only verifiable, market-observable inputs.
All components are normalized into a comparable scale and combined into a composite metric representing broad risk-seeking or risk-averse behaviour in global markets. While applicable to any instrument on TradingView, the indicator is particularly effective for cryptocurrency markets due to their historical sensitivity to equity volatility, liquidity cycles, and macroeconomic shifts.
📊 Components Included in the Index
Below is an overview of the internal factors used to compute the final score. Each item is independently transformed into a 0–100 range before aggregation.
1. S&P 500 Price Deviation (SPX 125-Day Distance)
Measures how far the S&P 500 is trading above or below its 125-day moving average.
Large positive deviations generally reflect elevated risk-taking, while negative deviations suggest conservative market posture.
2. 52-Week Range Position (NYSE Composite)
Evaluates the NYSE Composite’s distance from its annual high/low range.
A higher relative position indicates greater market confidence, whereas lower values capture prolonged weakness or systemic stress.
3. Advance/Decline Momentum (ADVN vs. DECN)
Applies smoothing to the net difference between advancing and declining issues.
This highlights internal market participation, breadth conditions, and the balance between accumulation and distribution phases.
4. Put/Call Ratio Pressure (PCC)
Uses a smoothed version of the equity put/call ratio.
A higher put/call ratio (inverted here) reflects risk aversion, while lower ratios align with speculative environments.
5. VIX Relative Position (VIX vs. 50-Day Average)
Compares the current VIX value to its 50-day moving average.
VIX above its mean implies elevated volatility and fear; values below suggest calmer conditions and stronger risk appetite.
6. Equity vs. Treasury Performance (SPX vs. US10Y)
Contrasts 20-day returns of equities and U.S. 10-year bonds.
Strong equity performance relative to treasuries is normally associated with risk-on flows, while the opposite reflects defensive positioning.
7. High-Yield Spread (JNK vs. US10Y)
Tracks the yield differential between high-yield bonds and U.S. Treasury rates.
A wider spread captures stress in credit markets; a narrower spread indicates improved confidence.
🧮 Composite Calculation
The indicator computes each component independently, normalizes the values into a 0–100 scale using a consistent methodology, and then calculates the simple average.
This ensures transparency and avoids hidden weighting schemes or model bias.
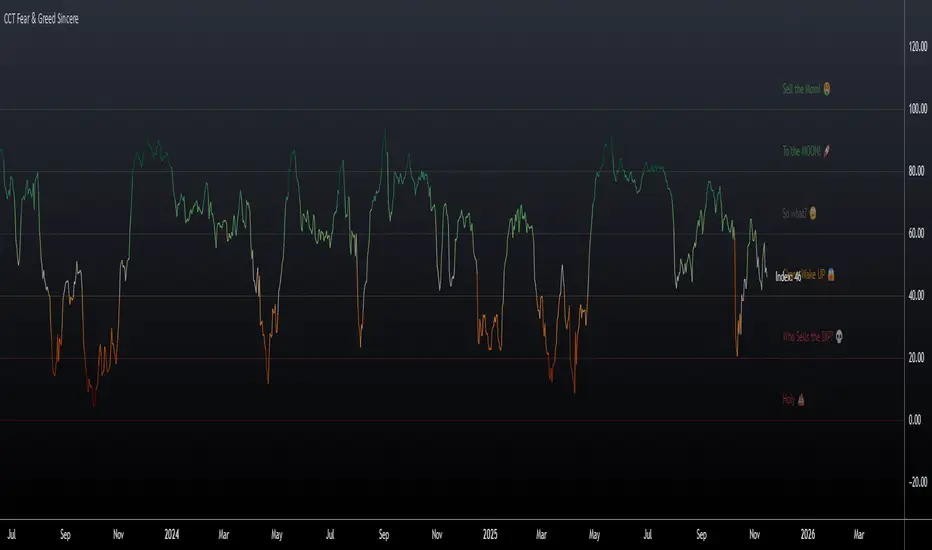
The final index is plotted as a continuous line with adaptive coloring based on its current level, visually highlighting shifts between fear-dominant and greed-dominant market states.
📈 Suggested Usage
The indicator can be applied to any tradable asset, but it tends to be especially informative for:
Cryptocurrencies, due to their pronounced reaction to global liquidity and risk sentiment.
High-beta stocks, which often mirror broader volatility cycles.
Macro-focused analysis, where risk-on/risk-off transitions impact multiple asset classes simultaneously.
This tool is intended as a contextual framework rather than a standalone signal generator. Market participants may use it to contextualize regime changes, identify extremes, or complement existing technical strategies.
📏 Fear & Greed Levels Included in the Indicator
These levels are plotted with dedicated labels and tooltips to offer additional visual clarity:
Level Interpretation
0 – “Holy 💩” Extreme market stress; structural capitulation environment.
20 – “Who Sells the DIP?” Strong fear signal; frequently aligns with oversold conditions.
40 – “C’mon Wake UP!” Cautious or bearish environment; transitional zone.
60 – “So What?” Neutral risk environment; consolidation or equilibrium.
80 – “To the MOON!” Elevated risk appetite; momentum-driven phases.
100 – “Sell the MOM!” Peak optimism; historically associated with overheated conditions.
These thresholds do not provide direct buy/sell instructions; they are reference bands designed to help illustrate the structural context of market behavior.
📌 Why This Indicator Is Uniquely Updated
Uses 7 fully technical components
Zero survey sentiment
Zero social media data
Zero alternative datasets or search trend metrics
Fully transparent, fully reproducible, and based only on market-derived inputs
Built on Pine Script® v6, aligned with modern TradingView standards
Does not rely on proprietary or black-box scoring systems
This positions the CCT Fear & Greed Sincere as one of the most technically grounded and transparent fear/greed-style indicators available using only TradingView-native data.
The CCT Fear & Greed Sincere indicator provides a consolidated view of macro-market conditions using exclusively price-derived and market-structure data. The goal is to translate multiple independent risk-appetite components into a unified 0–100 index. This tool does not rely on survey sentiment, alternative datasets, or social indicators; it uses only verifiable, market-observable inputs.
All components are normalized into a comparable scale and combined into a composite metric representing broad risk-seeking or risk-averse behaviour in global markets. While applicable to any instrument on TradingView, the indicator is particularly effective for cryptocurrency markets due to their historical sensitivity to equity volatility, liquidity cycles, and macroeconomic shifts.
📊 Components Included in the Index
Below is an overview of the internal factors used to compute the final score. Each item is independently transformed into a 0–100 range before aggregation.
1. S&P 500 Price Deviation (SPX 125-Day Distance)
Measures how far the S&P 500 is trading above or below its 125-day moving average.
Large positive deviations generally reflect elevated risk-taking, while negative deviations suggest conservative market posture.
2. 52-Week Range Position (NYSE Composite)
Evaluates the NYSE Composite’s distance from its annual high/low range.
A higher relative position indicates greater market confidence, whereas lower values capture prolonged weakness or systemic stress.
3. Advance/Decline Momentum (ADVN vs. DECN)
Applies smoothing to the net difference between advancing and declining issues.
This highlights internal market participation, breadth conditions, and the balance between accumulation and distribution phases.
4. Put/Call Ratio Pressure (PCC)
Uses a smoothed version of the equity put/call ratio.
A higher put/call ratio (inverted here) reflects risk aversion, while lower ratios align with speculative environments.
5. VIX Relative Position (VIX vs. 50-Day Average)
Compares the current VIX value to its 50-day moving average.
VIX above its mean implies elevated volatility and fear; values below suggest calmer conditions and stronger risk appetite.
6. Equity vs. Treasury Performance (SPX vs. US10Y)
Contrasts 20-day returns of equities and U.S. 10-year bonds.
Strong equity performance relative to treasuries is normally associated with risk-on flows, while the opposite reflects defensive positioning.
7. High-Yield Spread (JNK vs. US10Y)
Tracks the yield differential between high-yield bonds and U.S. Treasury rates.
A wider spread captures stress in credit markets; a narrower spread indicates improved confidence.
🧮 Composite Calculation
The indicator computes each component independently, normalizes the values into a 0–100 scale using a consistent methodology, and then calculates the simple average.
This ensures transparency and avoids hidden weighting schemes or model bias.
The final index is plotted as a continuous line with adaptive coloring based on its current level, visually highlighting shifts between fear-dominant and greed-dominant market states.
📈 Suggested Usage
The indicator can be applied to any tradable asset, but it tends to be especially informative for:
Cryptocurrencies, due to their pronounced reaction to global liquidity and risk sentiment.
High-beta stocks, which often mirror broader volatility cycles.
Macro-focused analysis, where risk-on/risk-off transitions impact multiple asset classes simultaneously.
This tool is intended as a contextual framework rather than a standalone signal generator. Market participants may use it to contextualize regime changes, identify extremes, or complement existing technical strategies.
📏 Fear & Greed Levels Included in the Indicator
These levels are plotted with dedicated labels and tooltips to offer additional visual clarity:
Level Interpretation
0 – “Holy 💩” Extreme market stress; structural capitulation environment.
20 – “Who Sells the DIP?” Strong fear signal; frequently aligns with oversold conditions.
40 – “C’mon Wake UP!” Cautious or bearish environment; transitional zone.
60 – “So What?” Neutral risk environment; consolidation or equilibrium.
80 – “To the MOON!” Elevated risk appetite; momentum-driven phases.
100 – “Sell the MOM!” Peak optimism; historically associated with overheated conditions.
These thresholds do not provide direct buy/sell instructions; they are reference bands designed to help illustrate the structural context of market behavior.
📌 Why This Indicator Is Uniquely Updated
Uses 7 fully technical components
Zero survey sentiment
Zero social media data
Zero alternative datasets or search trend metrics
Fully transparent, fully reproducible, and based only on market-derived inputs
Built on Pine Script® v6, aligned with modern TradingView standards
Does not rely on proprietary or black-box scoring systems
This positions the CCT Fear & Greed Sincere as one of the most technically grounded and transparent fear/greed-style indicators available using only TradingView-native data.
Protected script
This script is published as closed-source. However, you can use it freely and without any limitations – learn more here.
TA / OnChain Analyst since 2018
Official TA Analyst of LigaCrypto YT Channel
Back/Front end Developer
Official TA Analyst of LigaCrypto YT Channel
Back/Front end Developer
Disclaimer
The information and publications are not meant to be, and do not constitute, financial, investment, trading, or other types of advice or recommendations supplied or endorsed by TradingView. Read more in the Terms of Use.