OPEN-SOURCE SCRIPT
Trend Intensity
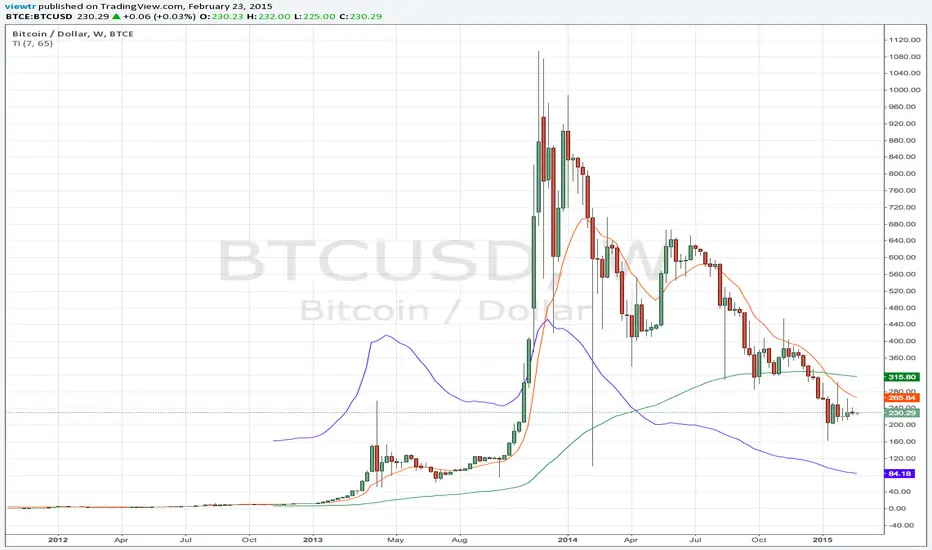
The Trend Intensity indicator measures the strength of the trend. Trend intensity tells us whether we are in an up or downtrend.
Ex:
A TI value of 150 means that the 7 day moving average is currently 50% above the 65 day moving average. This tells us that prices were moving up quickly in recent history.
A TI value of 80 tells us that the 7 day moving average is currently 20% below the 65 day moving average. This tells us that prices were moving down in recent history.
Open-source script
In true TradingView spirit, the creator of this script has made it open-source, so that traders can review and verify its functionality. Kudos to the author! While you can use it for free, remember that republishing the code is subject to our House Rules.
Disclaimer
The information and publications are not meant to be, and do not constitute, financial, investment, trading, or other types of advice or recommendations supplied or endorsed by TradingView. Read more in the Terms of Use.