OPEN-SOURCE SCRIPT
Consolidation Breakout Signal
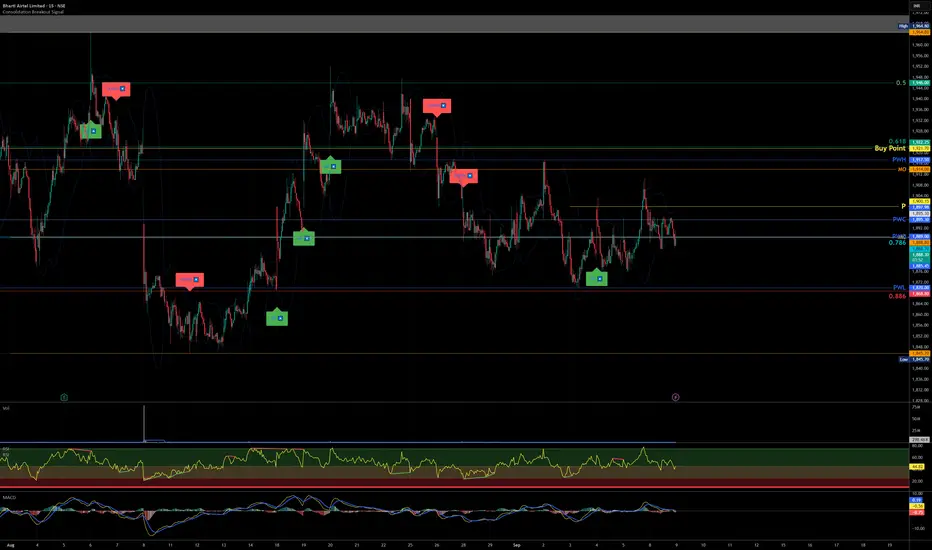
//version=5
indicator("Consolidation Breakout Signal", overlay=true, timeframe="")
// Inputs
length = input.int(20, "Consolidation Lookback")
atrMult = input.float(1.5, "ATR Breakout Multiplier")
bbLength = input.int(20, "Bollinger Band Length")
bbMult = input.float(2.0, "Bollinger Band Width Multiplier")
// ATR for volatility
atr = ta.atr(length)
// Bollinger Bands for consolidation
basis = ta.sma(close, bbLength)
dev = bbMult * ta.stdev(close, bbLength)
upperBB = basis + dev
lowerBB = basis - dev
bbWidth = (upperBB - lowerBB) / basis * 100
// Define consolidation as narrow BB width
consolidation = bbWidth < ta.sma(bbWidth, length)
// Breakout conditions
breakUp = consolidation and close > upperBB and close > close[1] + atrMult * atr
breakDown = consolidation and close < lowerBB and close < close[1] - atrMult * atr
// Plot Bollinger Bands
plot(upperBB, "Upper BB", color=color.new(color.blue, 70))
plot(lowerBB, "Lower BB", color=color.new(color.blue, 70))
// Plot signals
plotshape(breakUp, title="Breakout Up", style=shape.labelup, color=color.green, text="UP 🔼", size=size.large, location=location.belowbar)
plotshape(breakDown, title="Breakout Down", style=shape.labeldown, color=color.red, text="DOWN 🔽", size=size.large, location=location.abovebar)
// Alerts
alertcondition(breakUp, title="Breakout Up Alert", message="Big Up Move Likely 🚀")
alertcondition(breakDown, title="Breakout Down Alert", message="Big Down Move Likely 📉")
Open-source script
In true TradingView spirit, the creator of this script has made it open-source, so that traders can review and verify its functionality. Kudos to the author! While you can use it for free, remember that republishing the code is subject to our House Rules.
Disclaimer
The information and publications are not meant to be, and do not constitute, financial, investment, trading, or other types of advice or recommendations supplied or endorsed by TradingView. Read more in the Terms of Use.