OPEN-SOURCE SCRIPT
Highest Volume Bar from a Lower Timeframe
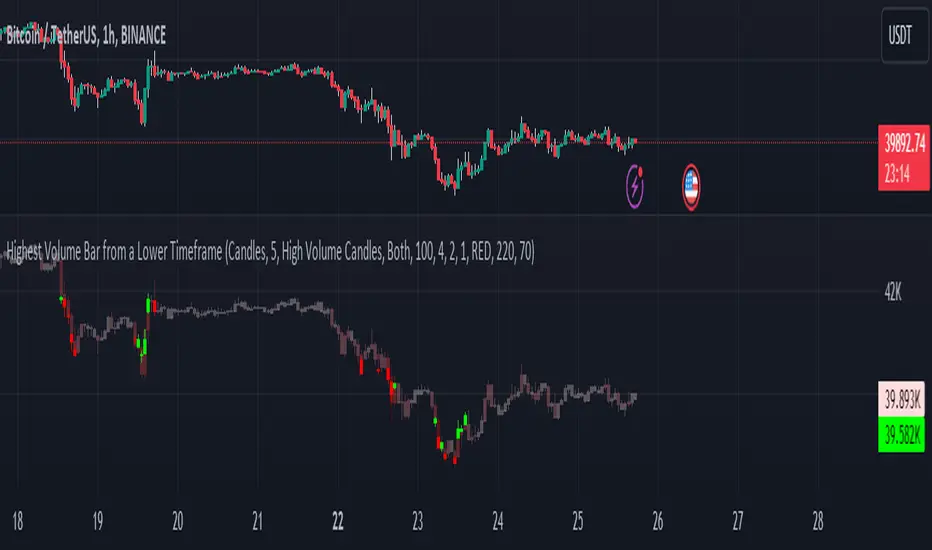
Volume is an essential indicator in technical analysis as it can signal confirmations of movement, reversals, and more. This indicator was developed to identify candles with high volume in both the current timeframe and a lower timeframe
SETTINGS
The indicator has two display modes: Candles and Volume.
- Candles: it presents a traditional candlestick chart that shows the candles of the current timeframe, along with the candle with the highest volume from the lower timeframe.
- Volume: it features a volume chart displaying the volume of the current timeframe in histogram form, as well as the bar with the highest volume from the lower timeframe represented in columns.
LOWER TIME FRAME SETTINGS
- Lower Time Frame: the lower timeframe to be taken into consideration.
- LTF Candle Display: determines which candles from the current timeframe chart will display the candles with the highest volume from the lower timeframe.
- Volume Display: determines how the volume bars will be presented for both the current timeframe and the lower timeframe.
VOLUME LEVEL SETTINGS
- SMA Period: the time period for calculating the volume average.
- High Volume: the multiplier used to classify a candle as having high volume.
- Medium Volume: the multiplier used to classify a candle as having medium volume.
- Low Volume: the multiplier used to classify a candle as having low volume.
- Show Volume MA: enable this option to display the Volume MA on the chart.
COLOR SETTINGS
- Candle Color: the color to be used in the charts.
- Shade Intensity [1-255]: the intensity of the shades for volume levels.
- Transparency [1-100]: the transparency to be used for the candles of the current timeframe when displaying candles with higher volume from the lower timeframe.
Open-source script
In true TradingView spirit, the creator of this script has made it open-source, so that traders can review and verify its functionality. Kudos to the author! While you can use it for free, remember that republishing the code is subject to our House Rules.
Disclaimer
The information and publications are not meant to be, and do not constitute, financial, investment, trading, or other types of advice or recommendations supplied or endorsed by TradingView. Read more in the Terms of Use.