OPEN-SOURCE SCRIPT
Updated Stock metrics and value

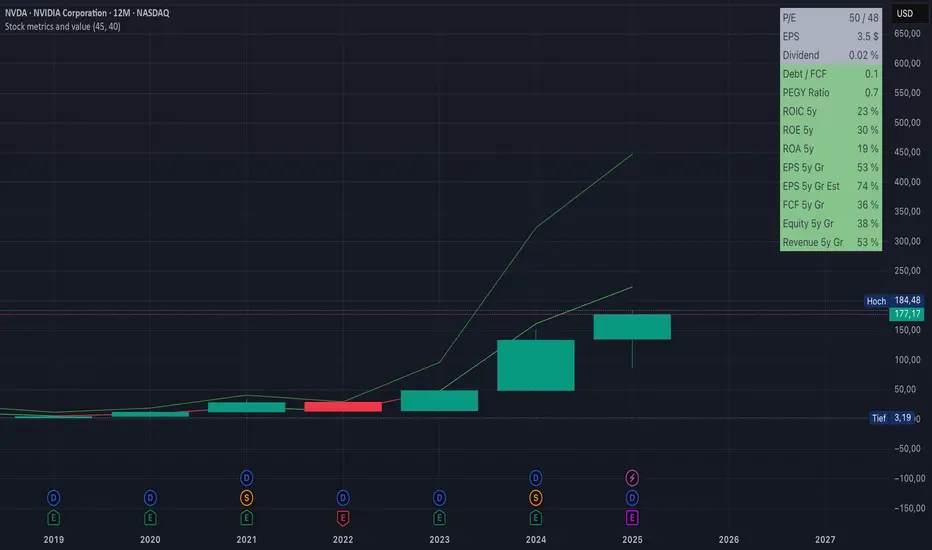
This indicator shows:
- the valuation metrics for a stock on a table on top right: PE, EPS, dividend, ROIC, ROE, ROA, EPS growth, FCF growth, Equity growth, revenue Growth
- the fair value and the value with 50% margin of safety as chart lines
The lines will be red when they are above the current price and red when they are below the current price.
The colors on the table will be red when the values are below 10% and green when they are above, that means when everything is green the metrics for the stock are good.
Release Notes
Added the type "depository receipt" to be included for this indicatorRelease Notes
- Changed the calculation of the value to estimate only 5 years ahead with 15% yield instead of 10 years- Changed the past growth calculations to 5 years instead of 10 years
Release Notes
Added Peter Lynch's PEGY ratio, P/E devided by (growth rate + dividend yield)Open-source script
In true TradingView spirit, the creator of this script has made it open-source, so that traders can review and verify its functionality. Kudos to the author! While you can use it for free, remember that republishing the code is subject to our House Rules.
Disclaimer
The information and publications are not meant to be, and do not constitute, financial, investment, trading, or other types of advice or recommendations supplied or endorsed by TradingView. Read more in the Terms of Use.
Open-source script
In true TradingView spirit, the creator of this script has made it open-source, so that traders can review and verify its functionality. Kudos to the author! While you can use it for free, remember that republishing the code is subject to our House Rules.
Disclaimer
The information and publications are not meant to be, and do not constitute, financial, investment, trading, or other types of advice or recommendations supplied or endorsed by TradingView. Read more in the Terms of Use.