PROTECTED SOURCE SCRIPT
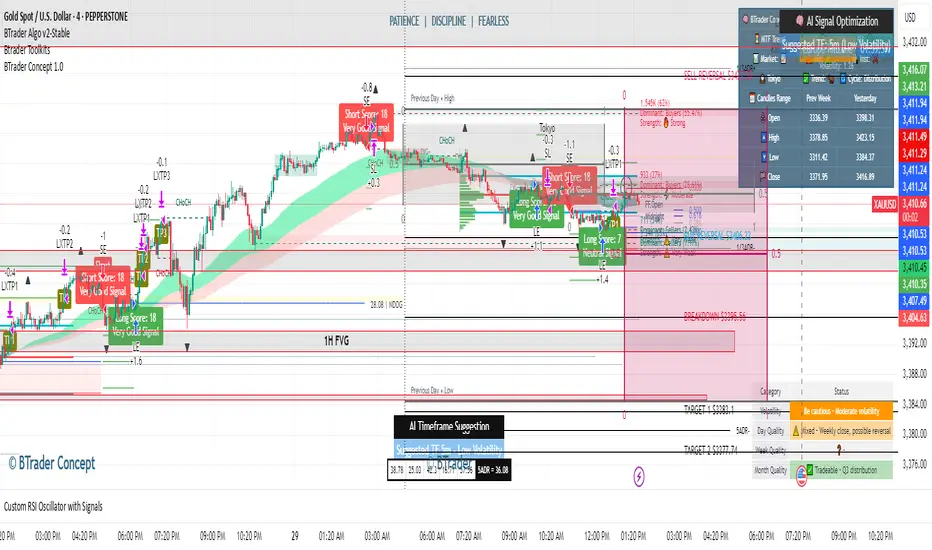
Custom RSI Oscillator with Signals
//version=5
indicator("Custom RSI Oscillator", overlay=false)
// Inputs
length = input.int(14, "RSI Length")
overbought = input.int(70, "Overbought Level")
oversold = input.int(30, "Oversold Level")
// RSI Calculation
rsiValue = ta.rsi(close, length)
// Plot RSI
plot(rsiValue, color=color.blue, linewidth=2, title="RSI")
// Levels
hline(overbought, "Overbought", color=color.red)
hline(oversold, "Oversold", color=color.green)
hline(50, "Midline", color=color.gray)
// Background Highlights
bgcolor(rsiValue > overbought ? color.new(color.red, 85) : na)
bgcolor(rsiValue < oversold ? color.new(color.green, 85) : na)
Protected script
This script is published as closed-source. However, you can use it freely and without any limitations – learn more here.
Disclaimer
The information and publications are not meant to be, and do not constitute, financial, investment, trading, or other types of advice or recommendations supplied or endorsed by TradingView. Read more in the Terms of Use.