PROTECTED SOURCE SCRIPT
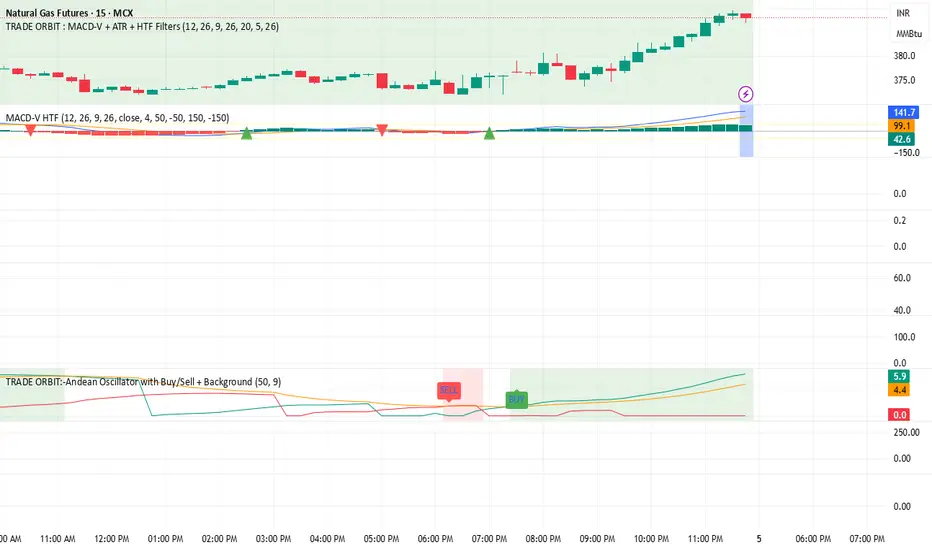
TRADE ORBIT:-Andean Oscillator with Buy/Sell + Background
//=============================================================================
// DESCRIPTION
//-----------------------------------------------------------------------------
// The Andean Oscillator is a trend-momentum tool that compares bullish and
// bearish pressure using dynamic envelopes derived from price. It evaluates
// the strength of upward vs downward movement and generates trade signals
// when bullish or bearish momentum aligns above a smoothed signal line.
//
// COMPONENTS
// -----------
// • Bull : Represents bullish pressure
// • Bear : Represents bearish pressure
// • Signal: EMA smoothing of the stronger of Bull/Bear
//
// SIGNAL LOGIC
// -------------
// ✅ BUY signal is generated when:
// 1) Bull crosses above Bear
// 2) Bull then crosses above the Signal line
//
// ✅ SELL signal is generated when:
// 1) Bear crosses above Bull
// 2) Bear then crosses above the Signal line
//
// BACKGROUND COLORS
// -----------------
// • Green background → Bull > Bear and Bull > Signal
// • Red background → Bear > Bull and Bear > Signal
//
// PLOTS
// -----
// • Green plot → Bullish component
// • Red plot → Bearish component
// • Orange plot → Signal line
//
// ADDITIONAL NOTES
// ----------------
// • Uses envelope calculation with EMA smoothing
// • State-tracking ensures proper trend recognition
// • Alert conditions are included for Buy and Sell signals
//
//=============================================================================
Protected script
This script is published as closed-source. However, you can use it freely and without any limitations – learn more here.
Disclaimer
The information and publications are not meant to be, and do not constitute, financial, investment, trading, or other types of advice or recommendations supplied or endorsed by TradingView. Read more in the Terms of Use.