OPEN-SOURCE SCRIPT
RSI v4 with Bands
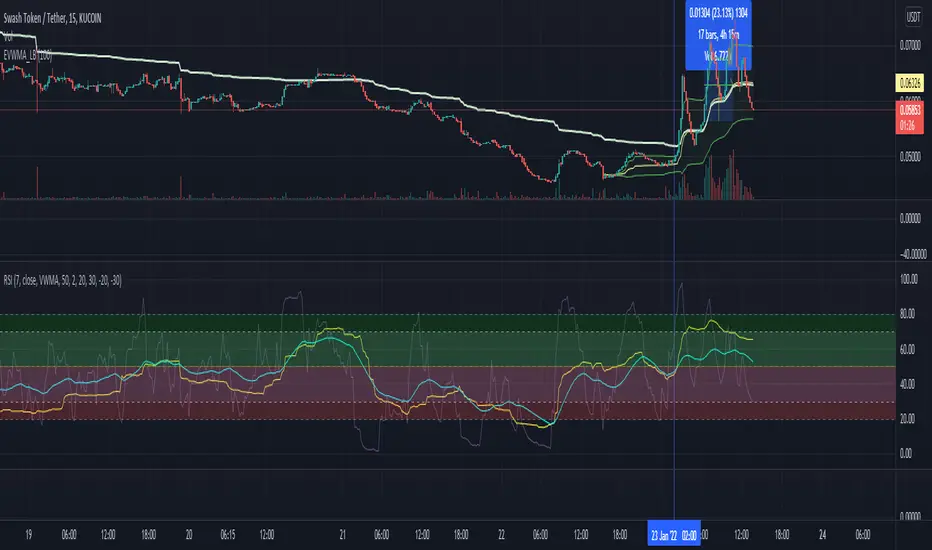
- Script is extended version of usual RSI script
This script plots VWMA(RSI7) [default colored orange] vs EMA(RSI7) [default colored blue] under pre-set time frame.
Strategy is to make sure both points remain in the Green zone while entering into BUY position
Use it as indicator not as financial advice.
~ imbharat
Open-source script
In true TradingView spirit, the creator of this script has made it open-source, so that traders can review and verify its functionality. Kudos to the author! While you can use it for free, remember that republishing the code is subject to our House Rules.
Disclaimer
The information and publications are not meant to be, and do not constitute, financial, investment, trading, or other types of advice or recommendations supplied or endorsed by TradingView. Read more in the Terms of Use.