OPEN-SOURCE SCRIPT
S&P 500 Weighted Advance Decline Line
S&P 500 Weighted Advance Decline Line Indicator
Overview
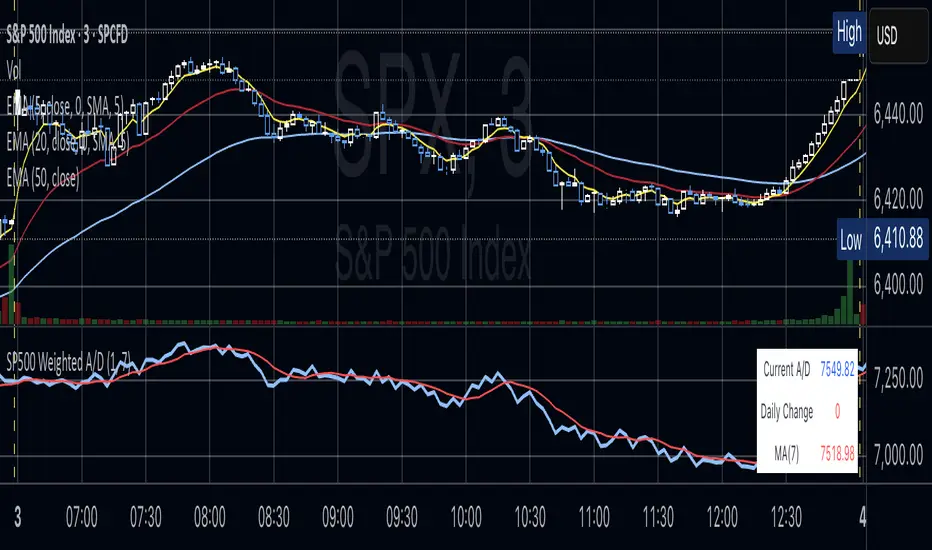
This indicator creates a market cap weighted advance/decline line for the S&P 500 that tracks breadth based on actual index weights rather than treating all stocks equally. By weighting each stock's contribution according to its true S&P 500 impact, it provides more accurate market breadth analysis and better insights into underlying market strength and potential turning points.
Key Features
Stock Coverage
Sector Breakdown:
Technology (29.8%) - Dominates the coverage as expected
Financials (5.8%) - Major banking and payment companies
Consumer/Retail (3.7%) - Consumer staples and retail giants
Healthcare (3.2%) - Pharma and healthcare services
Communication (1.97%) - Telecom and tech services
Energy (1.35%) - Oil and gas majors
Industrial (0.9%) - Aerospace and industrial equipment
Other Sectors (4.6%) - Miscellaneous including software and payments
Includes the 40 largest S&P 500 companies by weight, featuring:
How to Interpret
Trend Signals
Divergence Analysis
Confirmation
Settings
Limitations
Overview
This indicator creates a market cap weighted advance/decline line for the S&P 500 that tracks breadth based on actual index weights rather than treating all stocks equally. By weighting each stock's contribution according to its true S&P 500 impact, it provides more accurate market breadth analysis and better insights into underlying market strength and potential turning points.
Key Features
- Market Cap Weighted: Each stock contributes based on its actual S&P 500 weight
- Top 40 Stocks: Covers ~51% of the index with the largest companies
(limited by TradingView's 40 security call maximum for Premium accounts) - Real-Time Updates: Cumulative line shows long-term breadth trends
- Visual Indicators: Background coloring, moving average option, and data table
Stock Coverage
Sector Breakdown:
Technology (29.8%) - Dominates the coverage as expected
Financials (5.8%) - Major banking and payment companies
Consumer/Retail (3.7%) - Consumer staples and retail giants
Healthcare (3.2%) - Pharma and healthcare services
Communication (1.97%) - Telecom and tech services
Energy (1.35%) - Oil and gas majors
Industrial (0.9%) - Aerospace and industrial equipment
Other Sectors (4.6%) - Miscellaneous including software and payments
Includes the 40 largest S&P 500 companies by weight, featuring:
- Tech Leaders (29.8%): AAPL (7.0%), MSFT (6.5%), NVDA (4.5%), AMZN (3.5%), META (2.5%), GOOGL/GOOG (3.8%), AVGO (1.5%), ORCL (1.22%), AMD (0.51%), plus others
- Financials (5.8%): BRK.B (1.8%), JPM (1.2%), V (1.0%), MA (0.8%), BAC (0.63%), WFC (0.46%)
- Healthcare (3.2%): LLY (1.2%), UNH (1.2%), JNJ (1.1%), ABBV (0.8%), PG (0.9%)
- Consumer/Retail (3.7%): WMT (0.8%), HD (0.8%), COST (0.7%), KO (0.6%), PEP (0.6%), NKE (0.4%)
- Communication (1.97%): TMUS (0.47%), CSCO (0.47%), DIS (0.5%), CRM (0.5%)
- Energy** (1.35%): XOM (0.8%), CVX (0.55%)
- Industrial** (0.9%): GE (0.5%), BA (0.4%)
- Other Sectors (4.6%): PLTR (0.65%), ADBE (0.6%), PYPL (0.3%), plus others
How to Interpret
Trend Signals
- Rising A/D Line: Broad market strength, more weighted buying than selling
- Falling A/D Line: Market weakness, more weighted selling pressure
- Flat A/D Line: Balanced market conditions
Divergence Analysis
- Bullish Divergence: S&P 500 makes new lows but A/D Line holds higher
- Bearish Divergence: S&P 500 makes new highs but A/D Line fails to confirm
Confirmation
- Strong trends occur when both price and A/D Line move in the same direction
- Weak trends show when price moves but breadth doesn't follow
Settings
- Lookback Period: Days for advance/decline comparison (default: 1)
- Show Moving Average: Optional trend smoothing
- MA Length: Moving average period (default: 20)
Limitations
- Covers ~51% of S&P 500 (not complete market breadth)
- Optimized for TradingView Premium accounts (40 security limit)
- Heavy weighting toward mega-cap technology stocks
- Dependent on real-time data quality
Open-source script
In true TradingView spirit, the creator of this script has made it open-source, so that traders can review and verify its functionality. Kudos to the author! While you can use it for free, remember that republishing the code is subject to our House Rules.
Disclaimer
The information and publications are not meant to be, and do not constitute, financial, investment, trading, or other types of advice or recommendations supplied or endorsed by TradingView. Read more in the Terms of Use.