OPEN-SOURCE SCRIPT
Updated [blackcat] L1 Enveloped Oscillator
█ OVERVIEW
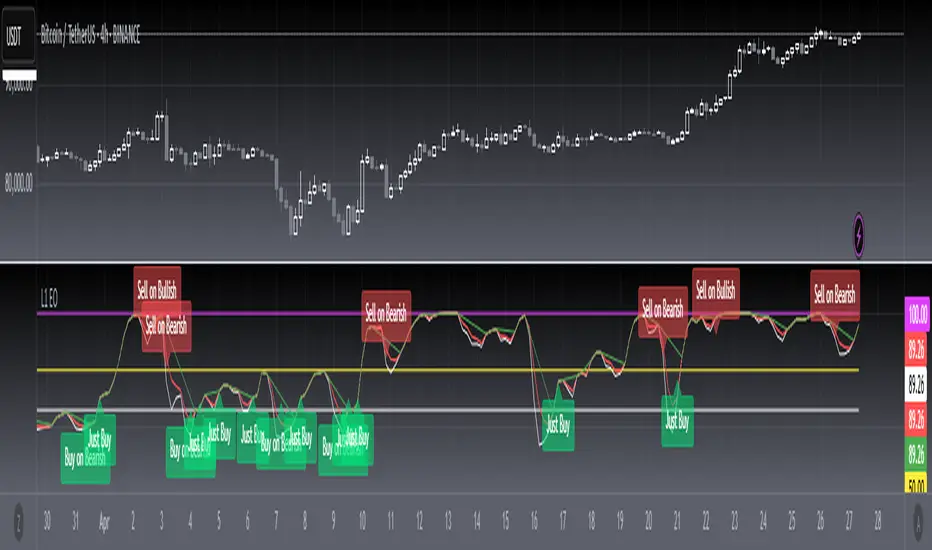
The script is an indicator named “[blackcat] L1 Enveloped Oscillator” (L1 EO) designed to plot various trend and oscillator values on a separate chart pane. It calculates multiple indicators such as trend, adjusted trend, oscillator, directional strength, and normalized oscillator, and uses these to detect potential buy and sell signals based on trend contractions, expansions, and divergences.
█ LOGICAL FRAMEWORK
Structure:
1 — Input Parameters: None are explicitly defined, but the script is parameterized within the function with fixed values for levels and periods.
2 — Calculations: The calculate_l1_enveloped_oscillator function computes multiple values including price bases, trend, oscillator, and adjusted trends. This function uses built-in Pine Script functions like ta.highest, ta.lowest, ta.ema, ta.sma, and math.max.
3 — Plotting: The calculated values are plotted on the chart using the plot function, with different colors and styles for visual distinction.
4 — Signal Detection: The script detects and labels potential buy and sell signals based on trend contractions, expansions, and divergences between the price and oscillator.
5 — Conditional Statements: Multiple if statements are used to determine when to place labels for buy and sell signals.
█ CUSTOM FUNCTIONS
• calculate_l1_enveloped_oscillator(high, low, close, open): Calculates various trend and oscillator values based on the input price data.
— Parameters: high, low, close, open (price data).
— Return Values: A tuple containing top_level, bottom_level, middle_level, adjusted_trend, trend, oscillator, directional_strength, normalized_oscillator, and adjusted_candle_trend.
█ KEY POINTS AND TECHNIQUES
• Advanced Pine Script Features: Utilizes built-in functions for technical analysis (ta.highest, ta.lowest, ta.ema, ta.sma, ta.crossover, ta.crossunder).
• Optimization Techniques: Uses fixed periods and levels for calculations, which can be adjusted for different market conditions.
• Best Practices: Clearly separates calculations and plotting, making the script modular and easier to maintain.
• Unique Approaches: Combines multiple indicators (trend, oscillator, directional strength) to detect complex market conditions like divergences and contractions/expansions.
█ EXTENDED KNOWLEDGE AND APPLICATIONS
• Modifications: Users can modify the levels (top_level, bottom_level, middle_level) and periods used in calculations to better suit specific asset classes or market conditions.
• Extensions: The script can be extended to include additional indicators or signals, such as RSI or MACD, to enhance its predictive power.
• Application Scenarios: Similar techniques can be applied in other trading strategies involving trend analysis and divergence detection, such as momentum trading or mean reversion strategies.
• Related Concepts: Users can explore other Pine Script concepts like alerts, backtesting, and optimization to fine-tune strategies based on historical data.
Release Notes
OVERVIEWThe L1 Enveloped Oscillator provides a comprehensive analysis of price trends and momentum using multiple technical indicators. It combines price oscillators, trend analysis, and divergence detection to identify potential trading opportunities.
FEATURES
• Multi-Component Trend Analysis
• Price Oscillator Integration
• Candle Trend Evaluation
• Divergence Detection
• Signal Generation with Labels
• Alert System
HOW TO USE
Apply the indicator to your chart
Monitor the following components:
Upper Bound (Fuchsia Line)
Lower Bound (White Line)
Center Line (Yellow Line)
Raw Trend (Red Line)
Adjusted Trend (White Line)
Look for:
Trend Contraction/Expansion
Divergence Patterns
Price Oscillator Crossovers
Bullish/Bearish Signals
TECHNICAL ANALYSIS
• Key Calculations:
Price Base and Extremes
Raw and Adjusted Trends
Price Oscillator
Price Strength
Normalized Oscillator
Candle Trend Value
• Signal Generation:
Bullish/Bearish Divergences
Trend Contractions
Price Oscillator Crossovers
Upper/Lower Bound Crossings
PARAMETERS
• Default Settings:
Upper Bound: 100
Lower Bound: 15
Center Line: 50
Various Moving Average Periods (21, 3, 5, 6)
LIMITATIONS
• May produce false signals during sideways markets
• Requires proper context for accurate interpretation
• Best used in trending conditions
NOTES
• Indicator works best on daily or higher timeframes
• Consider combining with other technical indicators
• Labels provide clear visual confirmation of signals
ALERTS
• Sell on Bullish Divergence
• Buy on Bearish Divergence
• Sell on Bearish Trend
• Just Sell Signal
• Just Buy Signal
THANKS
Special thanks to the TradingView community for their contributions and feedback.
Open-source script
In true TradingView spirit, the creator of this script has made it open-source, so that traders can review and verify its functionality. Kudos to the author! While you can use it for free, remember that republishing the code is subject to our House Rules.
Avoid losing contact!Don't miss out! The first and most important thing to do is to join my Discord chat now! Click here to start your adventure: discord.com/invite/ZTGpQJq 防止失联,请立即行动,加入本猫聊天群: discord.com/invite/ZTGpQJq
Disclaimer
The information and publications are not meant to be, and do not constitute, financial, investment, trading, or other types of advice or recommendations supplied or endorsed by TradingView. Read more in the Terms of Use.