Gold Spotter
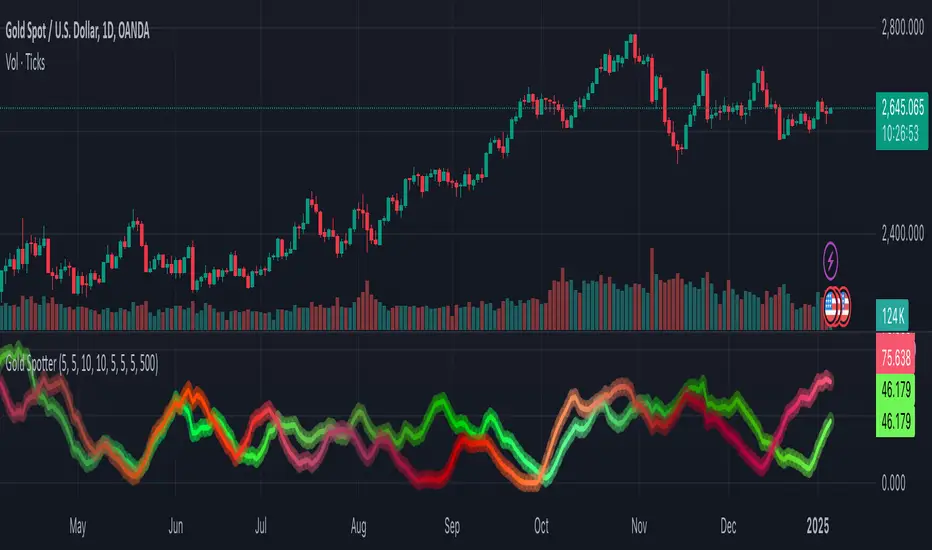
Two “Baskets” of Data
The script constructs two composite values (one green, one red) by fetching certain currency-related data in the background. Each composite is normalized over a lookback period so both lines map into a 0–100 range.
Weighting by Another Security’s Trend
A ratio is calculated from the chart’s own price vs. its moving average. That ratio is raised to a specified “power” (configured by the user), then used to scale each composite. This means if the price is above its average, both lines can be inflated; if below, both lines can be suppressed.
What the Lines Represent
Green Line: Represents a “pegged basket” index. (A small group of instruments that historically move in a certain way relative to Gold.)
Red Line: Represents an “exotics basket” index. (A different group of instruments that also has a meaningful relationship to Gold.)
What Is It Predicting
By measuring hidden relationships between these two baskets and weighting them by the chart’s trend, the green/red lines often provide an early read on which direction Gold might take next usually leading by 3-7 days.
Invite-only script
Only users approved by the author can access this script. You'll need to request and get permission to use it. This is typically granted after payment. For more details, follow the author's instructions below or contact JoeTheGoldTrader directly.
Note that this private, invite-only script has not been reviewed by script moderators, and its compliance with House Rules is undetermined. TradingView does NOT recommend paying for or using a script unless you fully trust its author and understand how it works. You may also find free, open-source alternatives in our community scripts.
Author's instructions
Disclaimer
Invite-only script
Only users approved by the author can access this script. You'll need to request and get permission to use it. This is typically granted after payment. For more details, follow the author's instructions below or contact JoeTheGoldTrader directly.
Note that this private, invite-only script has not been reviewed by script moderators, and its compliance with House Rules is undetermined. TradingView does NOT recommend paying for or using a script unless you fully trust its author and understand how it works. You may also find free, open-source alternatives in our community scripts.