OPEN-SOURCE SCRIPT
Support and Resistance
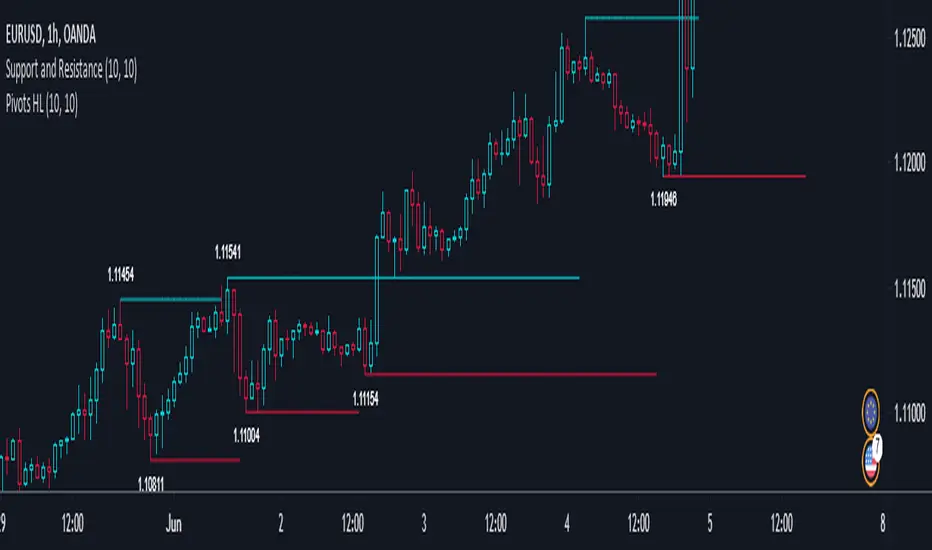
1. This indicator draw line at the pivot point to show possible support and resistance area.
2. The way it is drawn is pretty simple. Every time a pivot point is formed, a line is drawn on top of it.
3. The line will be delayed due to the nature of pivot point itself.
2. The way it is drawn is pretty simple. Every time a pivot point is formed, a line is drawn on top of it.
3. The line will be delayed due to the nature of pivot point itself.
Open-source script
In true TradingView spirit, the creator of this script has made it open-source, so that traders can review and verify its functionality. Kudos to the author! While you can use it for free, remember that republishing the code is subject to our House Rules.
Disclaimer
The information and publications are not meant to be, and do not constitute, financial, investment, trading, or other types of advice or recommendations supplied or endorsed by TradingView. Read more in the Terms of Use.