OPEN-SOURCE SCRIPT
Triple RSI Multi-Timeframe
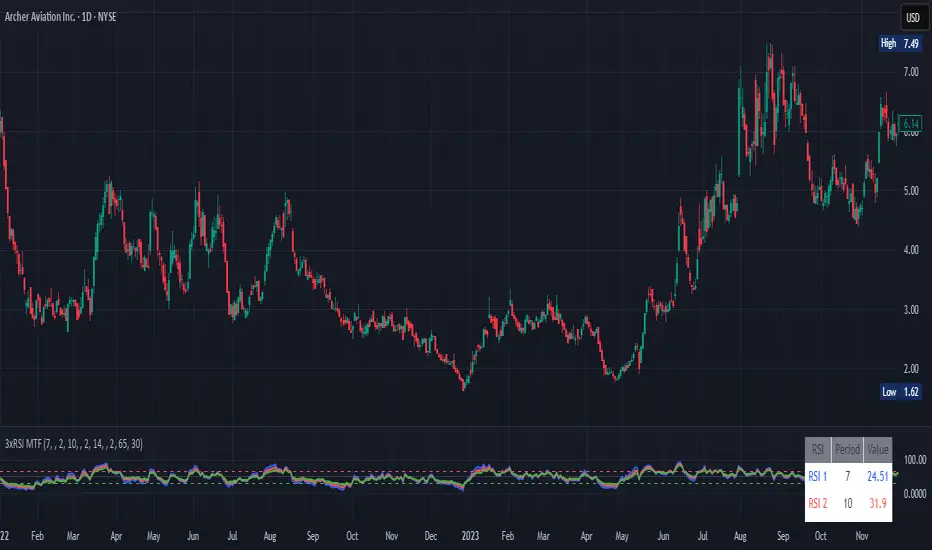
This indicator shows three RSI lines together so you can read market momentum on multiple timeframes at once. Each RSI has its own period, timeframe, and color, so you can quickly tell which line is fast, medium, or slow.
What it helps with
Spot overbought and oversold zones using the 70 and 30 levels, plus an optional midline at 50 for trend bias.
Align signals across timeframes: when two or three RSIs agree, the move is usually stronger.
Time entries and exits: use the shorter‑timeframe RSI for precise timing and the higher‑timeframe RSI for direction.
How to use
Choose the period and timeframe for RSI 1, 2, and 3 based on your style (e.g., 14 on current TF, 21 on 5m, 50 on 15m).
Pick distinct colors so you can recognize each line easily.
Turn on alerts to get notified when any RSI crosses into overbought or oversold.
Open-source script
In true TradingView spirit, the creator of this script has made it open-source, so that traders can review and verify its functionality. Kudos to the author! While you can use it for free, remember that republishing the code is subject to our House Rules.
Disclaimer
The information and publications are not meant to be, and do not constitute, financial, investment, trading, or other types of advice or recommendations supplied or endorsed by TradingView. Read more in the Terms of Use.