OPEN-SOURCE SCRIPT
CISD Trend Candle + MACD Signal
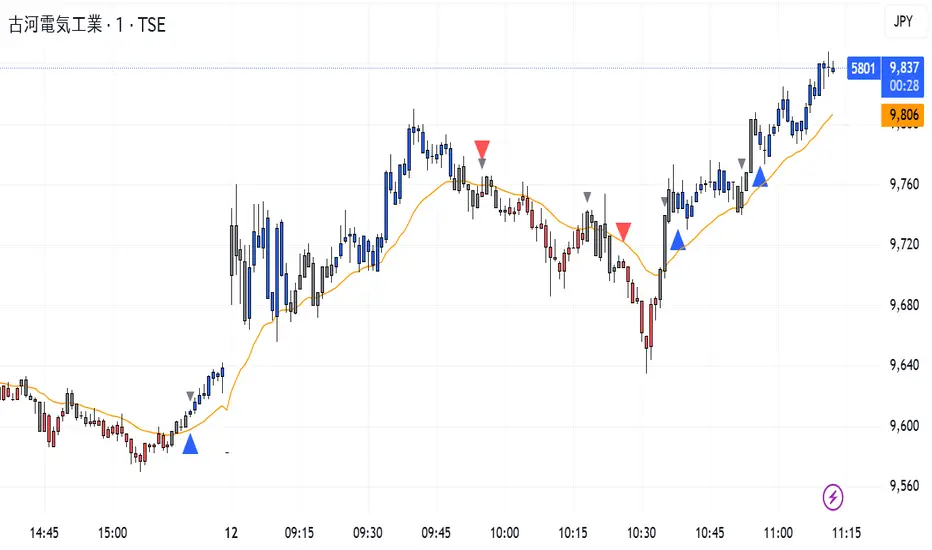
This custom TradingView indicator combines trend-based candle coloring with MACD reversal detection to generate clear entry and exit signals:
🔷 Blue triangle (Buy): Appears when the candles confirm an uptrend (e.g., 5 consecutive closes above 21 EMA) and no long position is currently held.
🔴 Red triangle (Sell): Appears when the candles confirm a downtrend (e.g., 5 consecutive closes below 21 EMA) and no short position is currently held.
⚪ Gray triangle (Exit):
If in a long position, it shows when the candle turns neutral (gray) and the MACD crosses down (bearish signal), or the trend turns red.
If in a short position, it shows when the candle turns neutral and the MACD crosses up (bullish signal), or the trend turns blue.
🟠 Orange line: 21-period EMA used for trend validation.
This logic prevents premature entries and provides structured exit points, aiming to avoid false signals in choppy markets.
Open-source script
In true TradingView spirit, the creator of this script has made it open-source, so that traders can review and verify its functionality. Kudos to the author! While you can use it for free, remember that republishing the code is subject to our House Rules.
Disclaimer
The information and publications are not meant to be, and do not constitute, financial, investment, trading, or other types of advice or recommendations supplied or endorsed by TradingView. Read more in the Terms of Use.