$ADD Indicator
In index investment, the USI:ADD is the Advance Decline Index that can be plotted in most charting platforms. Just like there is a volatility index for most major indeces (VIX, VOLQ) and even for Apple (CBOE:VXAPL), USI:ADD also has variations specific for the index you are analyzing (SPX: ADD, NASDAQ: ADDQ).
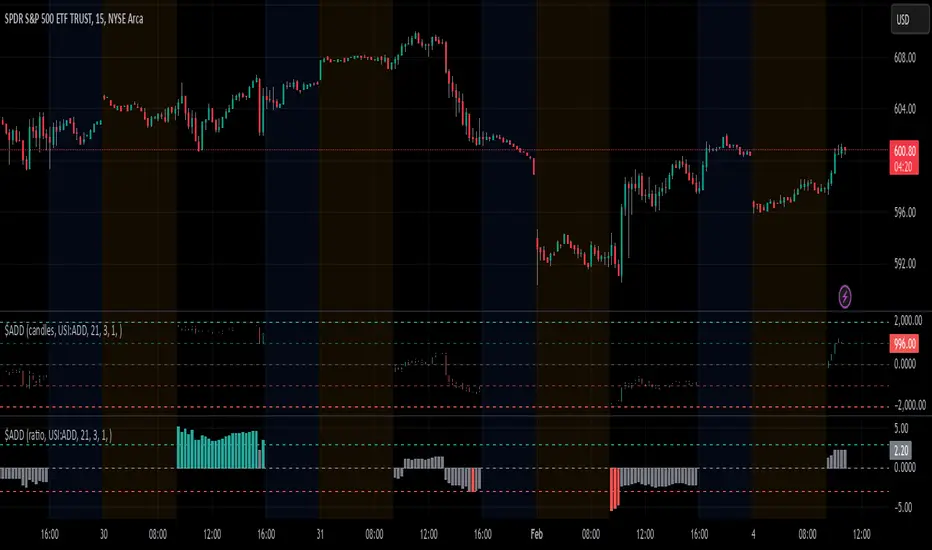
The USI:ADD index is a measurement of stocks in the index that are advancing (bullish) minus those that are declining (bearish).
The basic idea of how to use the ADD index is that when the value is above 1000 it is considered overbought. Conversely, when the value is below -1000 it is considered oversold. When the value is near the medium line, it is not a good idea to trade as it is considered to be in a choppy market.
Invite-only script
Only users approved by the author can access this script. You'll need to request and get permission to use it. This is typically granted after payment. For more details, follow the author's instructions below or contact TickSurfers directly.
Note that this private, invite-only script has not been reviewed by script moderators, and its compliance with House Rules is undetermined. TradingView does NOT recommend paying for or using a script unless you fully trust its author and understand how it works. You may also find free, open-source alternatives in our community scripts.
Author's instructions
Disclaimer
Invite-only script
Only users approved by the author can access this script. You'll need to request and get permission to use it. This is typically granted after payment. For more details, follow the author's instructions below or contact TickSurfers directly.
Note that this private, invite-only script has not been reviewed by script moderators, and its compliance with House Rules is undetermined. TradingView does NOT recommend paying for or using a script unless you fully trust its author and understand how it works. You may also find free, open-source alternatives in our community scripts.