PROTECTED SOURCE SCRIPT
Ultra High Volume Candles with Lines
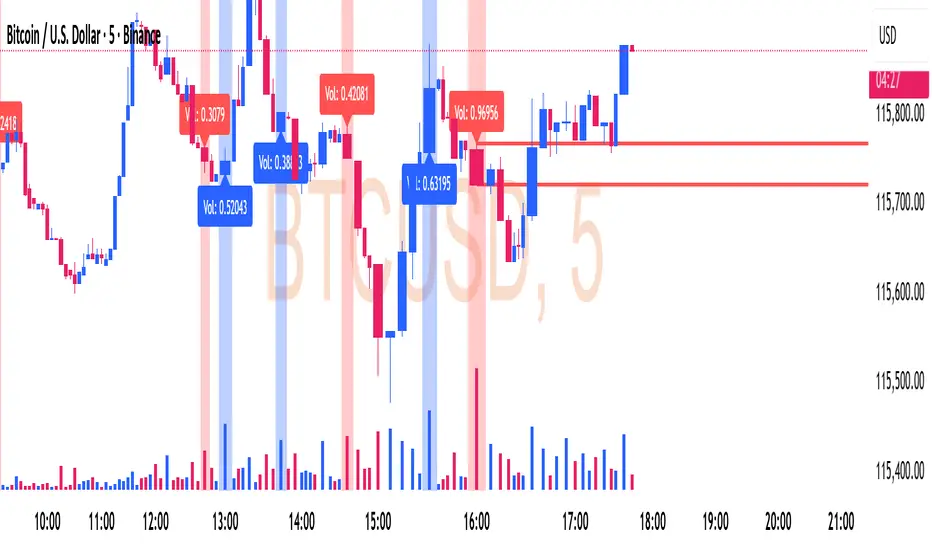
📊 Ultra High Volume (UHV) – Smart Money Alert 🚨
🔎 What is Ultra High Volume?
Ultra High Volume happens when a candle’s trading volume is much higher than the average volume of the last few bars.
👉 Example: If the average volume is 100k and suddenly a candle shows 300k → that’s Ultra High Volume.
It means big players (institutions, banks, funds) are active in that candle.
This is important because price moves strongly when big money participates.
🟥 Ultra High Volume Red Candle
When UHV appears on a red (bearish) candle:
🚩 It shows strong selling pressure.
📉 Can be a distribution phase (smart money unloading positions).
🛑 Often appears at resistance zones → possible trend reversal.
🎯 Sometimes it’s a stop-loss hunt before a reversal (fake push down).
🟦 Ultra High Volume Blue/Green Candle
When UHV appears on a blue/green (bullish) candle:
🚀 It shows strong buying pressure.
📈 Can be accumulation (smart money loading positions).
💥 Appears at breakout levels → signals continuation of the trend.
🛡️ Absorbs sellers before a big upward move.
⚖️ Why UHV is Important
UHV shows where smart money is active.
It tells us the market is at a decision point.
BUT ⚠️ → UHV doesn’t guarantee direction.
Always combine with:
✅ Market structure (higher highs, higher lows, CHoCH, BOS)
✅ Support & Resistance
✅ Order blocks and liquidity zones
📌 Example of Reading UHV
🔺 UHV at support → possible bounce (accumulation).
🔻 UHV at resistance → possible rejection (distribution).
💥 UHV during a breakout → confirms continuation.
❓ UHV in the middle of nowhere → usually a trap → avoid trading blindly.
💡 Key Takeaway
Volume = Fuel. Price moves with volume.
Ultra High Volume = Institutional footprint.
When you see it:
Don’t ignore 🚨
Look at the context (trend, structure, key zones)
Trade in sync with the big players
✨ UHV is not just a candle – it’s the market shouting at you: "Pay Attention!"
SETTINGS : Better result 4x volume candles
Protected script
This script is published as closed-source. However, you can use it freely and without any limitations – learn more here.
Disclaimer
The information and publications are not meant to be, and do not constitute, financial, investment, trading, or other types of advice or recommendations supplied or endorsed by TradingView. Read more in the Terms of Use.