OPEN-SOURCE SCRIPT
Akkerman IMB + Targets Indicator
Akkerman IMB + Targets Indicator
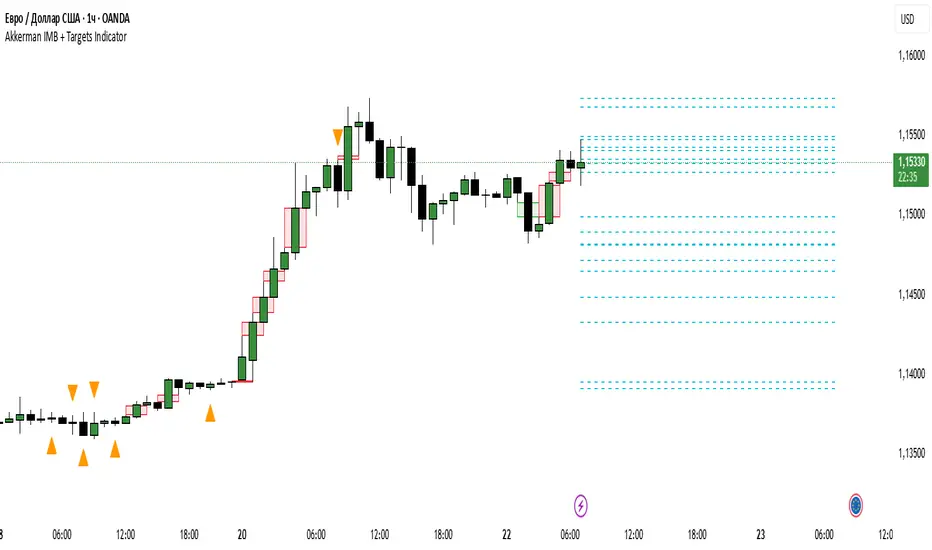
The Akkerman IMB + Targets Indicator is a powerful tool for traders who use the Smart Money Concept (SMC) methodology for intraday trading. This indicator combines several key elements of technical analysis, such as IMB (Imbalance) zones, liquidity zones, and intraday targets, to help traders identify significant levels on the chart for potential entry and exit points.
Main Features of the Indicator:
IMB (Imbalance) Zones:
The indicator detects IMB zones (imbalances) on the chart, which are often significant for the market because these zones can signal unsupported price moves where the market may either retrace or continue the move.
Green box — indicates a bullish IMB, where the price moves downward but does not reach the previous "low" level.
Red box — indicates a bearish IMB, where the price moves upward but does not reach the previous "high" level.
Liquidity Zones:
The indicator automatically identifies liquidity zones, which are critical levels for potential retracements or breakouts. These zones are determined by equal highs and lows on the chart (where the price has made similar highs or lows).
Triangles or lines highlight levels where significant buy or sell orders might be gathered.
Intraday Target Lines:
The indicator generates targets for intraday trading based on support and resistance levels over the last 10 periods.
These target lines on the chart indicate potential entry or exit points based on the lowest and highest prices over the past 10 bars, which represent key points for trading within the current session.
Indicator Settings:
Show IMB: Toggle to show or hide IMB zones on the chart.
Show Liquidity Zones: Toggle to show or hide liquidity zones on the chart.
Show Targets (Intraday): Toggle to show or hide intraday target lines.
Max Targets (maxTargets): Set the maximum number of targets to display on the chart.
How to Use:
IMB Zones help identify potential retracement or breakout zones on the market. These zones are a critical part of Smart Money analysis, as markets often retrace to these areas after significant price moves.
Liquidity Zones provide clues about where large orders may be gathered, which could lead to a retracement or breakout.
Intraday Targets assist in identifying important levels for entering or exiting trades within the current session to take advantage of short-term price movements.
Important Notes:
This indicator works best on the 1-hour timeframe (H1) for more accurate and stable signals.
For maximum effectiveness, it is recommended to combine this indicator with other technical indicators and analysis methods.
Open-source script
In true TradingView spirit, the creator of this script has made it open-source, so that traders can review and verify its functionality. Kudos to the author! While you can use it for free, remember that republishing the code is subject to our House Rules.
Disclaimer
The information and publications are not meant to be, and do not constitute, financial, investment, trading, or other types of advice or recommendations supplied or endorsed by TradingView. Read more in the Terms of Use.