PROTECTED SOURCE SCRIPT
BLACK MAGIC RSI
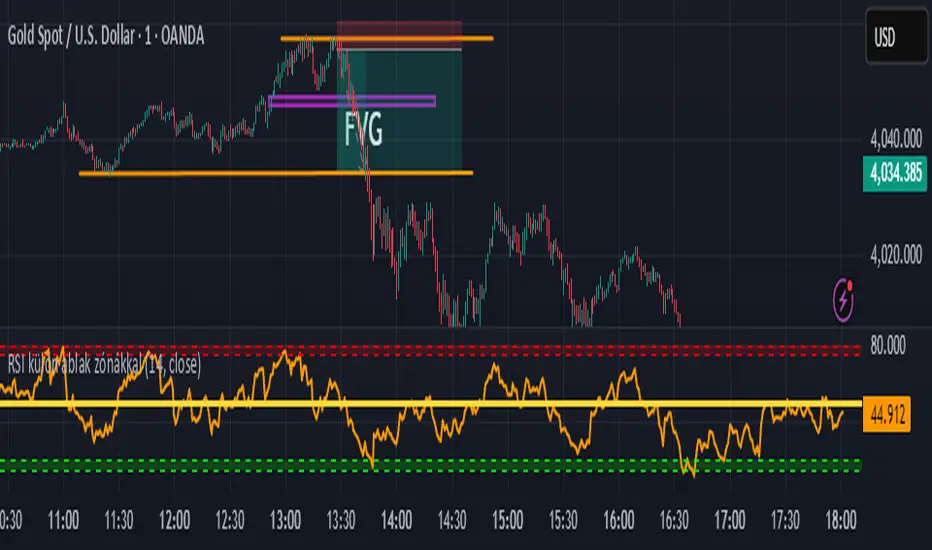
What Is the RSI?
The Relative Strength Index (RSI) is a momentum indicator used in technical analysis to measure the speed and strength of recent price movements. It was developed by J. Welles Wilder Jr. and is one of the most popular tools for identifying whether an asset is overbought or oversold.
🔹 How It Works
The RSI moves on a scale from 0 to 100 and compares the size of recent gains to recent losses.
When the RSI value is high, it means prices have risen quickly.
When the RSI value is low, it means prices have fallen sharply.
Protected script
This script is published as closed-source. However, you can use it freely and without any limitations – learn more here.
Disclaimer
The information and publications are not meant to be, and do not constitute, financial, investment, trading, or other types of advice or recommendations supplied or endorsed by TradingView. Read more in the Terms of Use.