OPEN-SOURCE SCRIPT
PumpC Tick Levels Marker
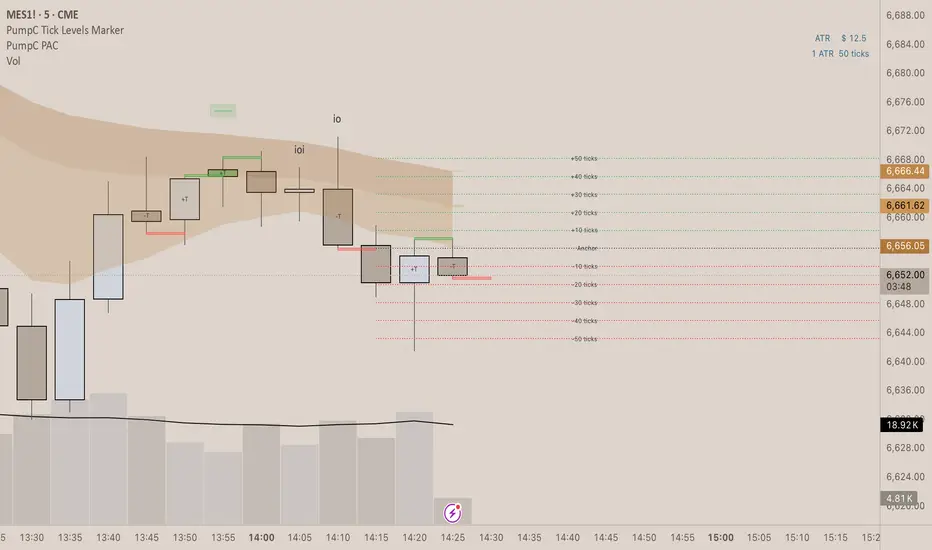
🧾 Description
PumpC Tick Levels Marker
A precision price-level visualization tool designed for futures and tick-based traders.
Easily mark a single reference price and automatically plot symmetrical tick levels above and below it.
🔍 How It Works
Select your Anchor Price — this acts as the central reference point.
The script automatically plots upward and downward tick levels spaced by your chosen tick multiple.
Labels display tick distance (+/- ticks) and can be offset to the right by a set number of bars for clean alignment near the price scale.
⚙️ Key Features
One-click anchor control — define a single reference price.
Custom tick spacing — choose your tick multiple and number of levels to show (up to 10 in each direction).
Independent Up/Down toggles — display only the levels you need.
Label offset control — move labels closer or farther from the price scale.
Fully customizable styling — line color, width, and style (solid, dashed, dotted).
Efficient cleanup logic — lines and labels refresh dynamically on update.
🧩 Perfect For
Futures and index traders tracking tick increments (e.g., ES, NQ, CL).
Measuring quick scalp targets or ATR-based micro-ranges.
Visualizing equidistant price steps from a key breakout or reversal point.
Created by: PumpC Trading Tools
Version: 1.0 (Pine Script v6)
License: Open for personal use — please credit “PumpC Tick Levels Marker” if reused or modified.
Open-source script
In true TradingView spirit, the creator of this script has made it open-source, so that traders can review and verify its functionality. Kudos to the author! While you can use it for free, remember that republishing the code is subject to our House Rules.
Disclaimer
The information and publications are not meant to be, and do not constitute, financial, investment, trading, or other types of advice or recommendations supplied or endorsed by TradingView. Read more in the Terms of Use.