PROTECTED SOURCE SCRIPT
Updated Multiple Timeframe Levels
Based on Rob Smith from T3Live's "The Strat" system.
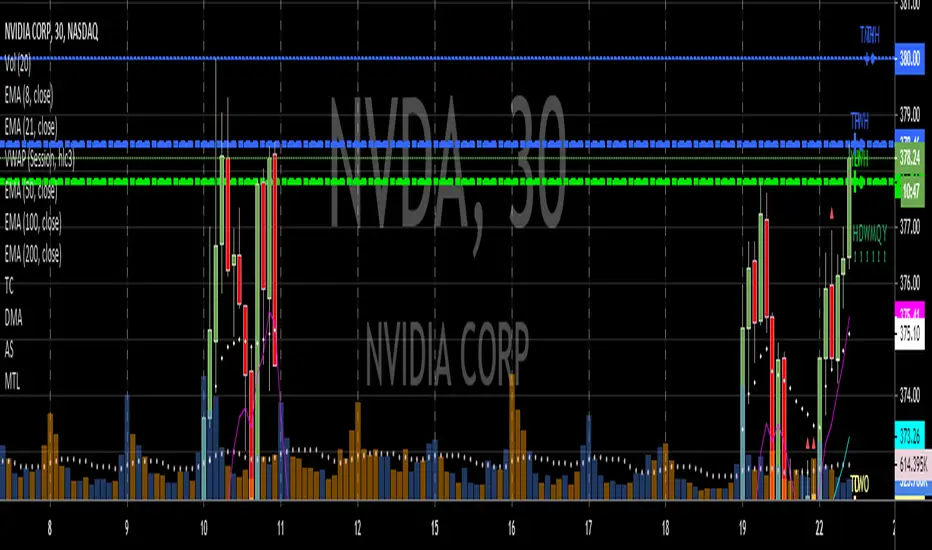
Draws lines and labels for high/low of prior day, current day, prior week, current week, prior month, current month, prior year and current year.
Draws lines and labels for current day, week, month and year open.
Not recommended for those who have not completed Rob's course.
Draws lines and labels for high/low of prior day, current day, prior week, current week, prior month, current month, prior year and current year.
Draws lines and labels for current day, week, month and year open.
Not recommended for those who have not completed Rob's course.
Release Notes
Cleaned up label names. Minor change.Release Notes
Moved all break of prior time frame level alerts from "Actionable Signals" script to this one.Release Notes
Alerts now include ticker and price at time alert was triggered.Example: "Prior Day Break (QQQ 196.50) "
The space at the end of the text is included so that you can more quickly add custom details.
Release Notes
Corrected coding translation errors between V3 and V4.Release Notes
Fixed a minor typoRelease Notes
Reversed the thickness of horizontal lines: Daily interval is thickest, monthly interval is thinnest.Protected script
This script is published as closed-source. However, you can use it freely and without any limitations – learn more here.
Disclaimer
The information and publications are not meant to be, and do not constitute, financial, investment, trading, or other types of advice or recommendations supplied or endorsed by TradingView. Read more in the Terms of Use.
Protected script
This script is published as closed-source. However, you can use it freely and without any limitations – learn more here.
Disclaimer
The information and publications are not meant to be, and do not constitute, financial, investment, trading, or other types of advice or recommendations supplied or endorsed by TradingView. Read more in the Terms of Use.