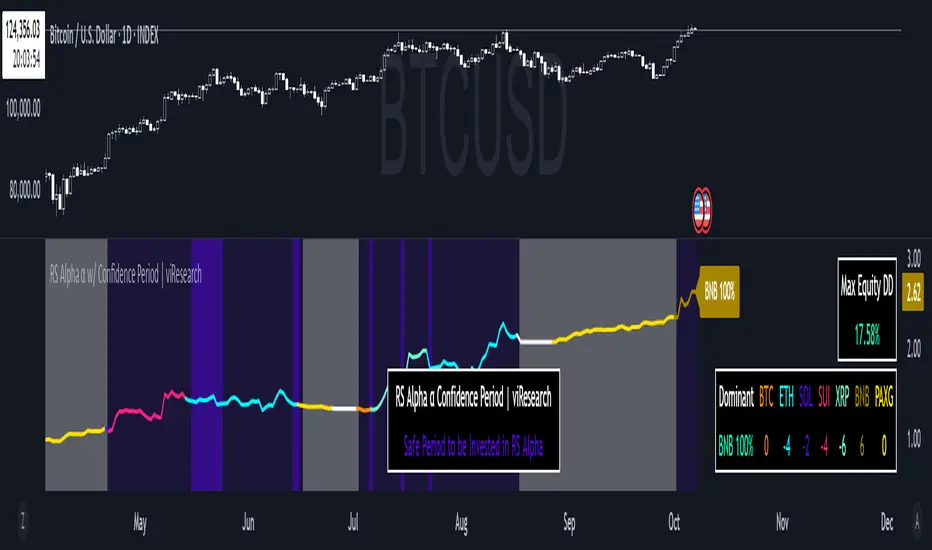
RS Alpha α w/ Confidence Period | viResearch
Conceptual Foundation and Innovation
The RS Alpha α w/ Confidence Period indicator from viResearch is a comprehensive multi-asset allocation and momentum-ranking system that integrates alpha–beta analysis, pairwise relative strength comparison, and volatility-adjusted confidence filtering.
Its primary objective is to identify dominant crypto assets during “safe” investment periods while dynamically reallocating exposure based on a calculated relative strength hierarchy.
At its core, RS Alpha α measures the systematic (β) and idiosyncratic (α) performance of each asset relative to Bitcoin (as the benchmark), combining these measures with inter-asset ratio trends to determine which assets exhibit superior momentum and market leadership.
The “Confidence Period” module introduces an additional dimension of market phase assessment, identifying safe and unsafe allocation windows based on historical equity peaks and troughs. This dynamic filter enhances portfolio resilience by restricting allocation to favorable trend conditions while avoiding high-risk market phases.
This integration of alpha–beta decomposition, relative strength comparison, and confidence-state filtering represents a quantitative evolution of traditional relative strength analysis, designed for adaptive asset rotation across major cryptocurrencies.
Technical Composition and Calculation
The indicator is structured around three major analytical layers:
1. Alpha–Beta Decomposition
-Each asset’s return is decomposed into systematic (beta) and idiosyncratic (alpha) components relative to Bitcoin using a covariance-based regression model.
-Assets with positive alpha above the median are considered outperformers and eligible for allocation.
2. Pairwise Ratio-Based Momentum Matrix
-Every asset is compared against all others through a ratio-trend matrix, where CCI-derived trend scores quantify the directional momentum between each pair.
-This matrix produces a relative strength score for each asset, reflecting its aggregate dominance in the group.
3. Confidence Period Logic (Dynamic Market Phases)
-Using the system’s internal equity curve, the script identifies peak (safe) and nadir (unsafe) periods.
-Allocation is only active during safe confidence phases, ensuring capital exposure aligns with favorable equity momentum.
-When enabled, the model can shift unallocated capital into PAXG (Gold-backed token) as a defensive asset.
By combining these layers, RS Alpha α w/ Confidence Period determines not only which assets to hold but also when to be invested, applying a systematic market-timing overlay to multi-asset selection.
Features and User Inputs
The indicator includes a rich set of customizable parameters to support portfolio and risk management preferences:
Start Date Filter – Defines the beginning of live strategy evaluation.
Display Options – Toggle drawdown metrics, background colorization, and intra-bar updates for visual customization.
Allocation Filters – Enable or disable intra-trend validation, trend source confirmation, or fallback to PAXG during cash periods.
Confidence Period Controls – Adjust the peak and nadir lookback lengths that govern safe/unsafe phase detection.
Asset Selection – Modify or replace up to seven crypto assets in the ranking matrix, including BTC, ETH, SOL, SUI, XRP, BNB, and PAXG.
Each module operates cohesively to maintain analytical transparency while allowing user-level control over system sensitivity and behavior.
Practical Applications
The RS Alpha α w/ Confidence Period indicator is suitable for both systematic traders and quantitative portfolio managers seeking dynamic asset rotation frameworks.
Key applications include:
Market Regime Detection: Identify and visualize transitions between “safe” and “unsafe” market environments using confidence overlays.
Alpha-Focused Asset Selection: Highlight crypto assets demonstrating statistically significant outperformance relative to Bitcoin.
Portfolio Rotation: Dynamically reallocate exposure toward leading assets while reducing capital risk during weak phases.
Risk-Managed Trend Participation: Utilize the confidence-state model to align exposure with favorable market momentum only.
This framework bridges quantitative finance with market regime analytics, enabling a disciplined and data-driven approach to crypto asset allocation.
Advantages and Strategic Value
RS Alpha α extends beyond traditional relative strength indicators by incorporating multi-asset covariance analysis, ratio-based dominance scoring, and volatility-aware regime filtering.
Its three-tier analytical framework — combining trend quality, performance attribution, and confidence-state validation — enhances the reliability of trend-following and rotation signals.
The system is particularly valuable for traders aiming to:
Reduce drawdowns during volatile phases.
Identify consistent outperformers early in developing market trends.
Maintain exposure only when statistical conditions indicate high confidence.
The integrated drawdown monitor, visual allocation tables, and dynamic alert system make RS Alpha α both powerful and transparent, suitable for discretionary and automated strategy workflows alike.
Alerts and Visualization
The script provides clear visual and alert-based feedback mechanisms:
Color-coded background zones differentiate safe vs. unsafe investment periods.
Allocation labels and tables display current dominant assets and their strength scores in real-time.
Max Drawdown Display offers ongoing performance diagnostics.
Alert System automatically notifies users when allocations change (e.g., “50% ETH / 50% SOL” or “100% CASH”).
These visualization features make the indicator not only analytically robust but also intuitively interpretable, even in live market environments.
Summary and Usage Tips
The RS Alpha α w/ Confidence Period | viResearch indicator represents a sophisticated evolution of relative strength analysis — combining alpha–beta decomposition, multi-asset momentum ranking, and dynamic confidence filtering to provide a structured, risk-aware framework for crypto asset rotation.
By integrating market regime awareness with systematic selection logic, it helps traders identify when to participate, what to hold, and when to stay defensive.
For best results, apply on the 1D timeframe as recommended, and use it alongside other viResearch systematic models for portfolio-level insight and tactical confirmation.
Note: Past performance does not guarantee future results. The indicator is intended for research and educational purposes within TradingView.
Invite-only script
Only users approved by the author can access this script. You'll need to request and get permission to use it. This is typically granted after payment. For more details, follow the author's instructions below or contact viResearch directly.
TradingView does NOT recommend paying for or using a script unless you fully trust its author and understand how it works. You may also find free, open-source alternatives in our community scripts.
Author's instructions
Disclaimer
Invite-only script
Only users approved by the author can access this script. You'll need to request and get permission to use it. This is typically granted after payment. For more details, follow the author's instructions below or contact viResearch directly.
TradingView does NOT recommend paying for or using a script unless you fully trust its author and understand how it works. You may also find free, open-source alternatives in our community scripts.