OPEN-SOURCE SCRIPT
EWMA Volatility Bands
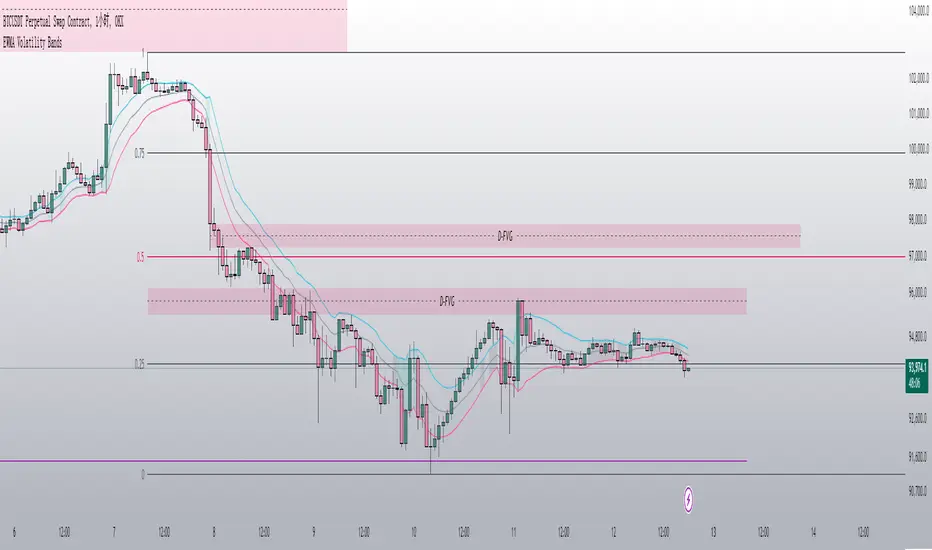
The EWMA Volatility Bands indicator combines an Exponential Moving Average (EMA) and Exponentially Weighted Moving Average (EWMA) of volatility to create dynamic upper and lower price bands. It helps traders identify trends, measure market volatility, and spot extreme conditions. Key features include:
Centerline (EMA): Tracks the trend based on a user-defined period.
Volatility Bands: Adjusted by the square root of volatility, representing potential price ranges.
Percentile Rank: Highlights extreme volatility (e.g., >99% or <1%) with shaded areas between the bands.
This tool is useful for trend-following, risk assessment, and identifying overbought/oversold conditions.
Open-source script
In true TradingView spirit, the creator of this script has made it open-source, so that traders can review and verify its functionality. Kudos to the author! While you can use it for free, remember that republishing the code is subject to our House Rules.
Disclaimer
The information and publications are not meant to be, and do not constitute, financial, investment, trading, or other types of advice or recommendations supplied or endorsed by TradingView. Read more in the Terms of Use.